Working with the Capital Dashboard
The Capital Dashboard provides multiple views, filters, and deep dive capabilities you can use to do the following:
Capital Planning - View capital requests, workflow status, and approval summaries for your organization.
Capital Tracking - View capital budget vs. committed vs. actuals as well as workflow status.
NOTE: The tabs that display depends on the Axiom license purchased by your organization. For example, if you do not have a license for Axiom Capital Tracking, then that tab will not display.
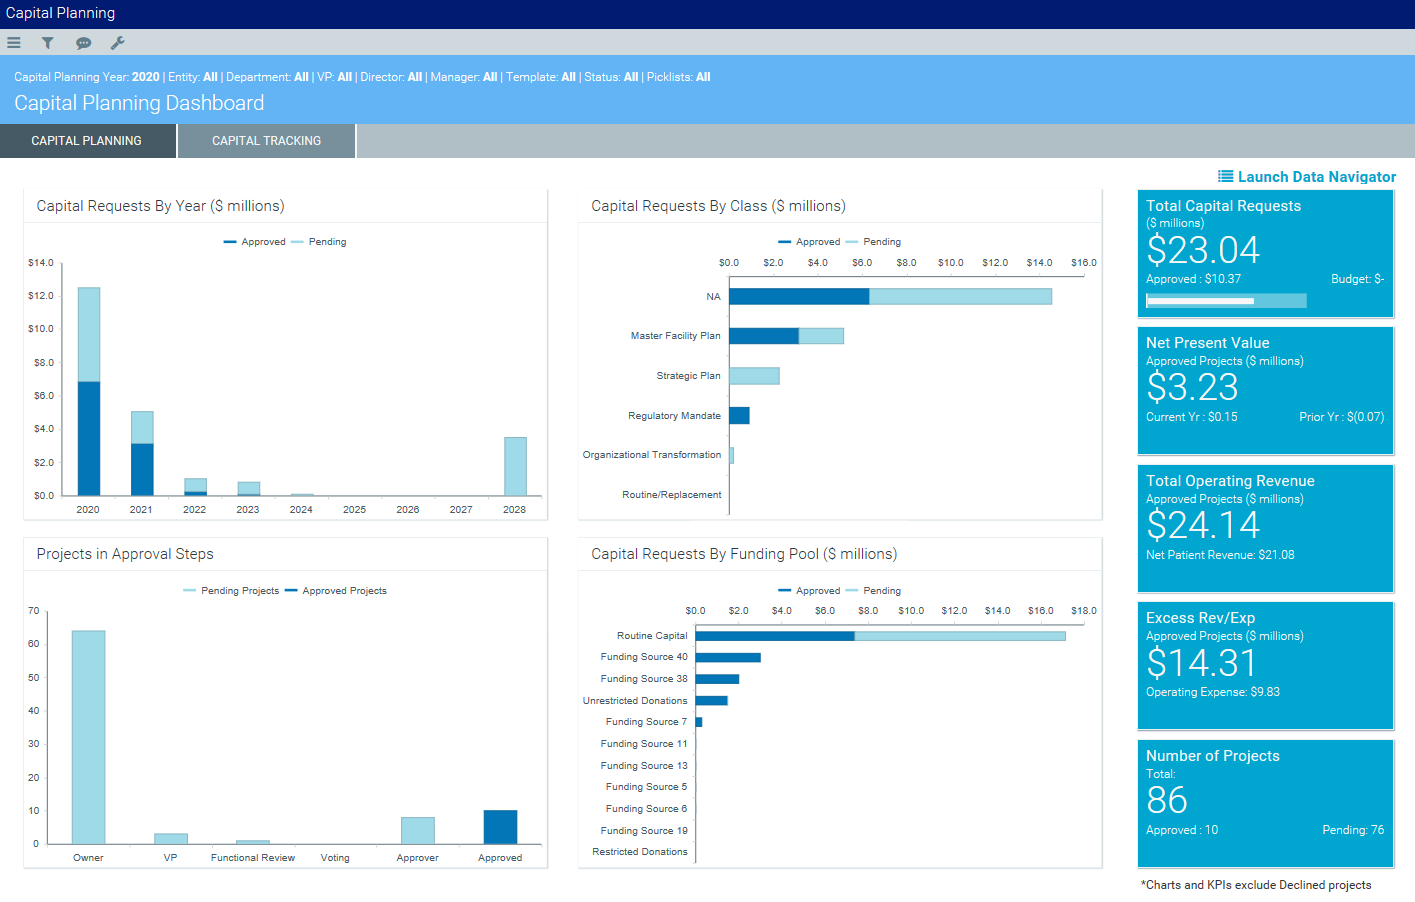
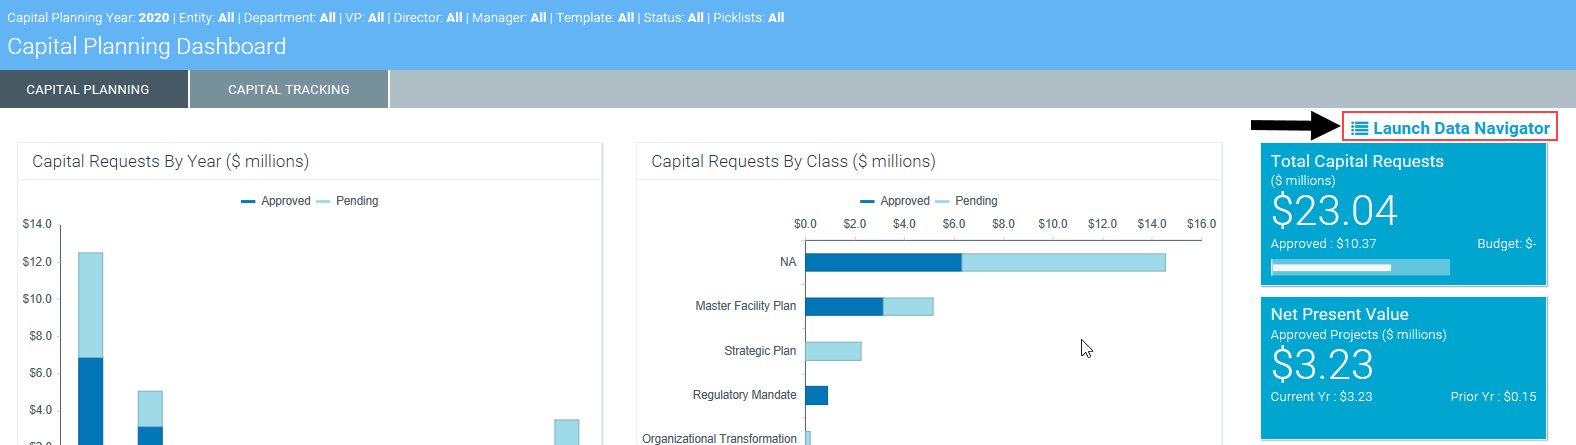
Capital Planning
The Capital Planning tab provides a summary and analysis of you capital planning process for each file group planning year. The dashboard charts shows the capital requests by year, class, and funding pool as well as the number of pending projects and where they are in the approval process.
The dashboard also shows KPIs regarding:
- Total number of capital request dollars, including how much has been approved and budgeted
- Net present value (NPV) of approved projects, including current and prior year dollars
- Total operating revenue of approved projects, including net patient revenue
- Excess revenue and expenses of approved projects, including operating expenses
- Total number of projects, including the number of approved and pending projects
NOTE: The charts and KPIs do not include declined projects.
You can filter data in the report using the Refresh Variables in the Filters panel. You can also dive deeper into the data and configure how the data displays by using the Data Navigator.
Capital Tracking
The Capital Tracking tab provides a summary and analysis of your capital requests. The dashboard charts shows the capital requests by year, the number of pending projects and where they are in the approval process, and actual vs. committed vs. budget projects.
The dashboard also shows KPIs regarding:
- Total number of capital request dollars, including how much has been approved and budgeted
- Net present value (NPV) of approved projects
- Total operating revenue of approved projects, including operating expenses and net income
- The amount of committed dollars across projects, including actual and dollar variance
- Total number of projects, including the number of approved and pending projects
NOTE: The charts and KPIs do not include declined projects.
You can filter data in the report using the refresh variables in the Filters panel. You can also dive deeper into the data behind the charts and KPIs by using the Data Navigator.
Using the Capital Dashboard
To use the Capital Dashboard:
-
Click the Area menu
 in the Global Navigation Bar, and click Capital Planning.
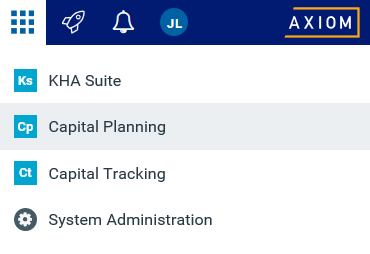
- From the home page, click Launch Capital Dashboard.
-
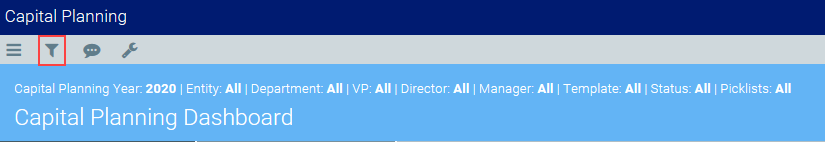
To filter the data in the dashboard, click the funnel icon in the upper left corner of the screen.
-
In the Filters panel, configure the variables by selecting the filter options to use, and then click Apply.
TIP: To keep the Filters panel open, click the thumb tack icon in the upper right corner of the panel.
-
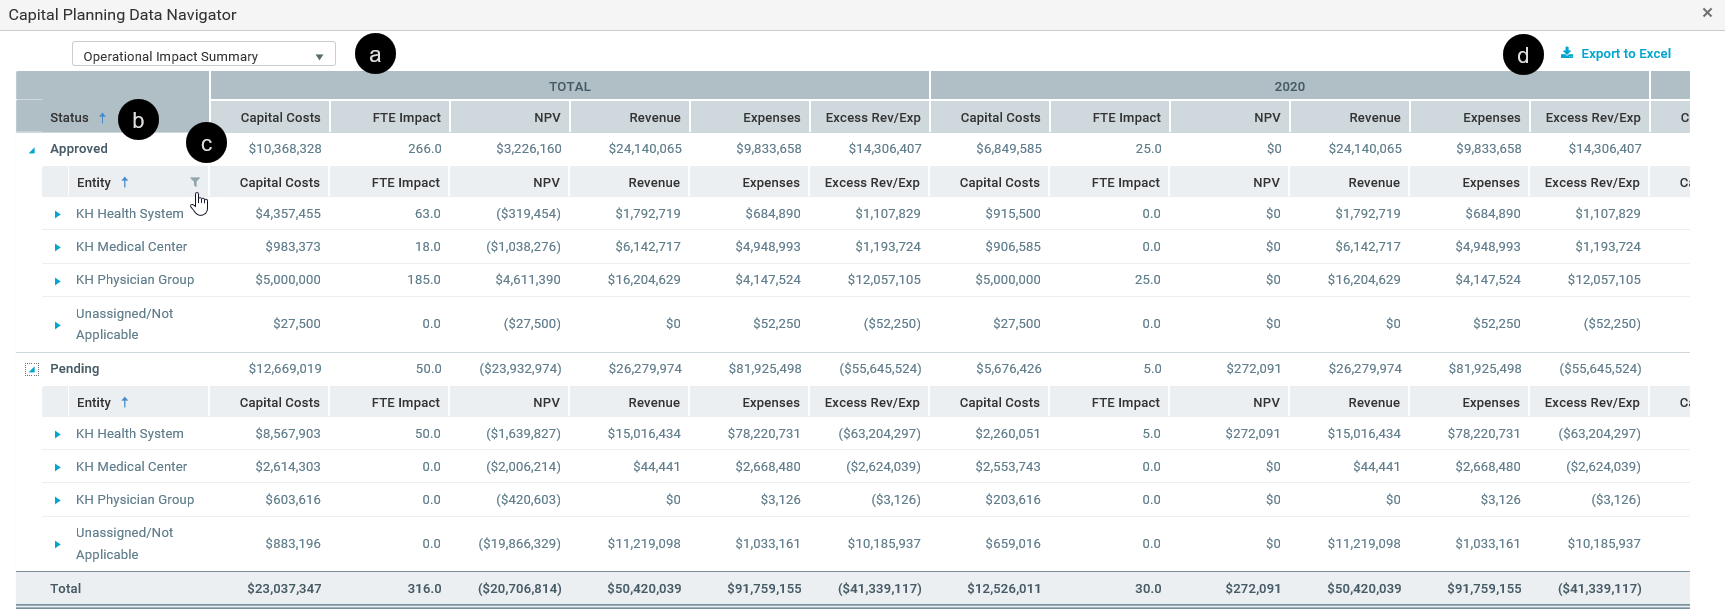
To deep dive into the data included in the report, click Launch Data Navigator.
- From the Data Navigator, do any of the following:
Click the drop-down to view data by the following: Operational Impact Summary, Project Summary by Dept, Project Summary by VP.
NOTE: Depending on the selection you make from this drop-down, the columns and hierarchical order will change.
- Click the header to organize the column in ascending or descending order.
- Click the funnel icon to filter the data in the column.
- Export the information from the Data Navigator to Excel.