Understanding Monthly Variance Analysis
Monthly Variance Analysis is focused on departmental volumes and all expenses. While this also includes Salary related expenses and FTEs, further analysis is often completed for these items by reviewing the bi-weekly the reports in the Labor Analysis section.
Steps and questions for reviewing monthly general ledger data:
-
Review monthly financial data for variances and determine cause of variances. Then, analyze whether variances will continue, could have been prevented, or were strategic (such as “bulk buy to reduce total costs”).
-
Review monthly financial data for positive and negative trends.
A focus on expense per unit (also known as per key statistic) values in volume-sensitive areas is particularly useful to determine if any expense variances are caused by a volume variance, a rate or cost variance, or related to efficiency. For example, if an expense line item is showing a variance and the actual expense per unit equals the budgeted expense per unit, this situation is considered a Volume variance. However, if the line item’s actual expense per unit is higher than the budgeted expense per unit, volume cannot be the cause of the variance. In this case, you would determine the following:
-
Is the price we are paying for the supply or service higher than budgeted causing a Rate variance? If so are there ways to lower the price? Or was this an unexpected cost increase that will cause a budget variance for the rest of the year?
-
Are we using more of the supply or service on a per unit basis than planned causing an Efficiency variance, or
-
Is there a combination of the circumstances above causing the variance to be attributed to both Rate and Efficiency?
In each case, why is this occurring and can we get a lower price or use the resource more efficiently?
The following tools in the Manager Monthly Package can be used for this review:
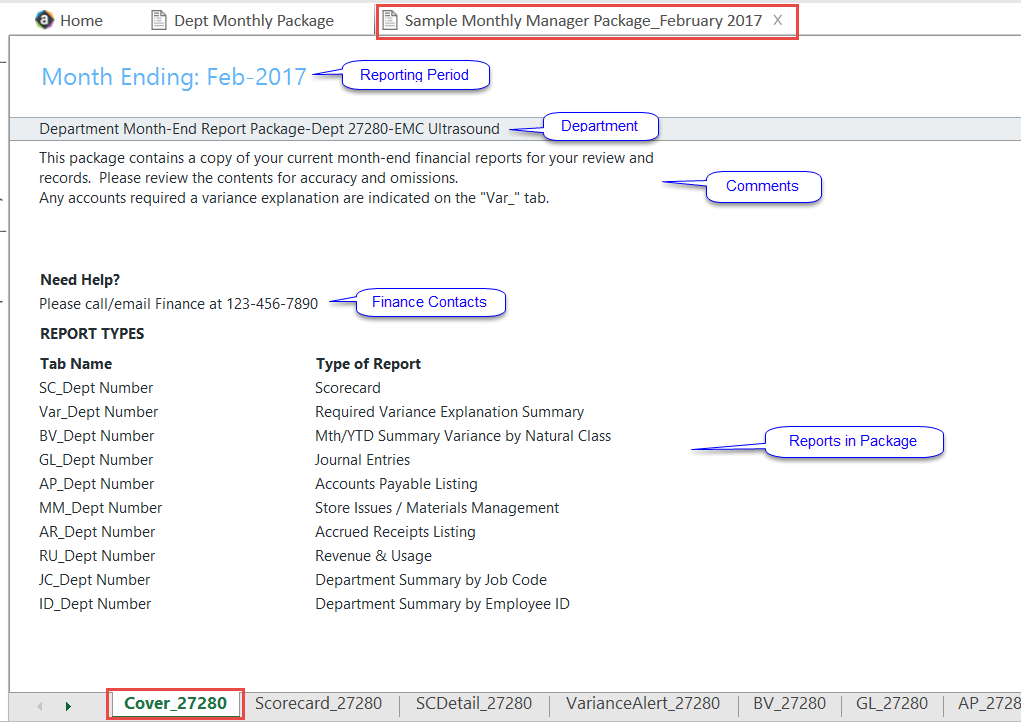
The Cover tab is the first sheet that displays within the Dept Monthly Package. It is also included as part of the Manager’s month-end distributed package.
This sheet provides general information such as the current reporting period and type of information provided within each report.
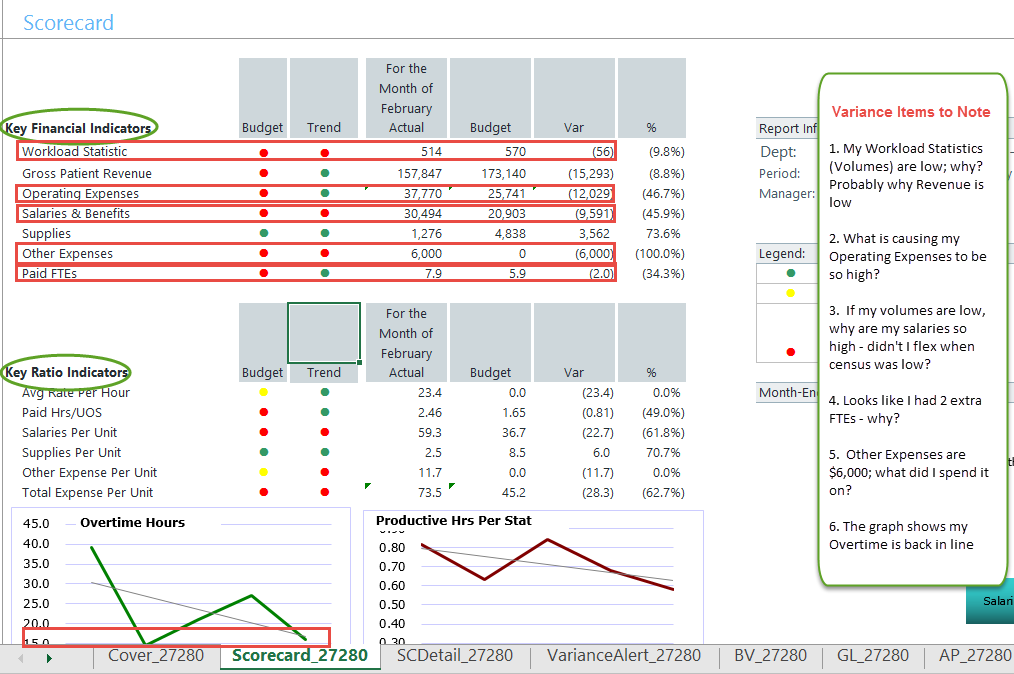
The Scorecard report shows Key Financial and Ratio Indicators. It provides an overview of departmental performance, and highlights areas requiring further review.
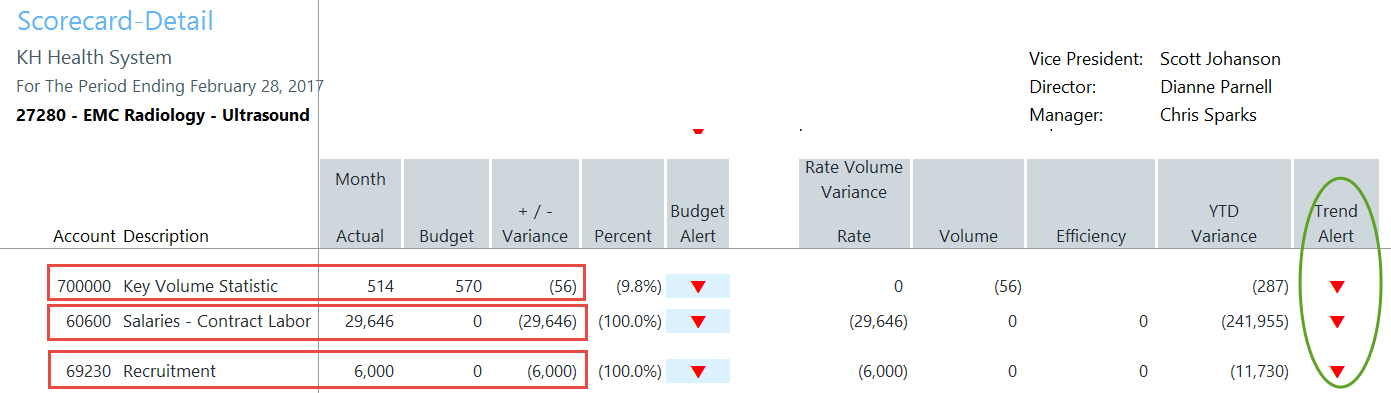
Scorecard Detail report (SCDetail)
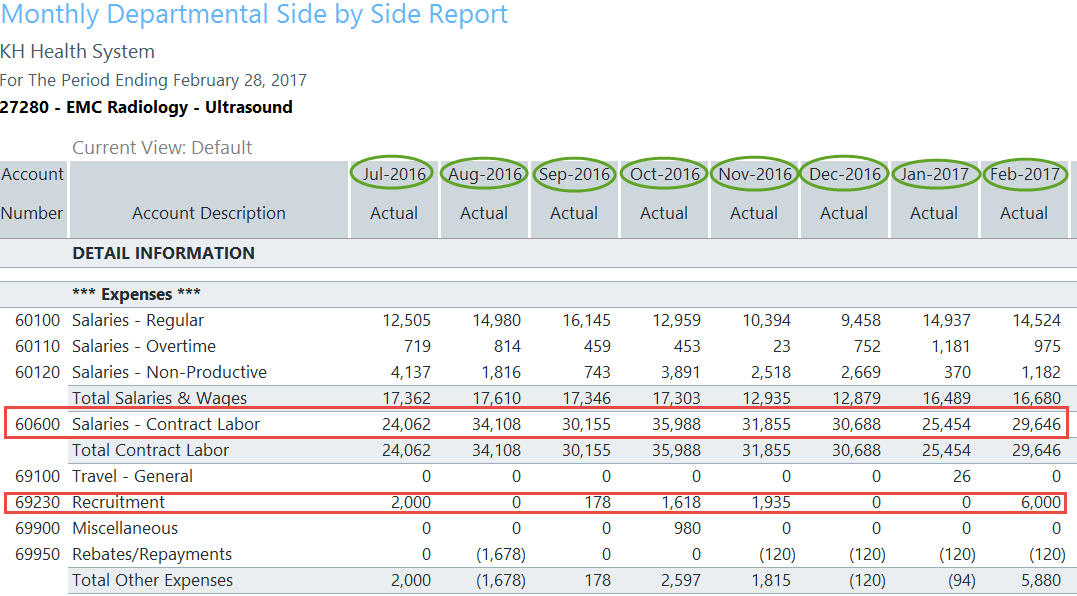
The Scorecard Detail report (SCDetail) shows actual versus budget information and flags the areas requiring variance comment input explanations within the Axiom Variance Comments Collection module.
Note that some additional details can be derived from this report, we can now answer some of the questions posed within the Variance Items to Note box from the previous Scorecard section:
-
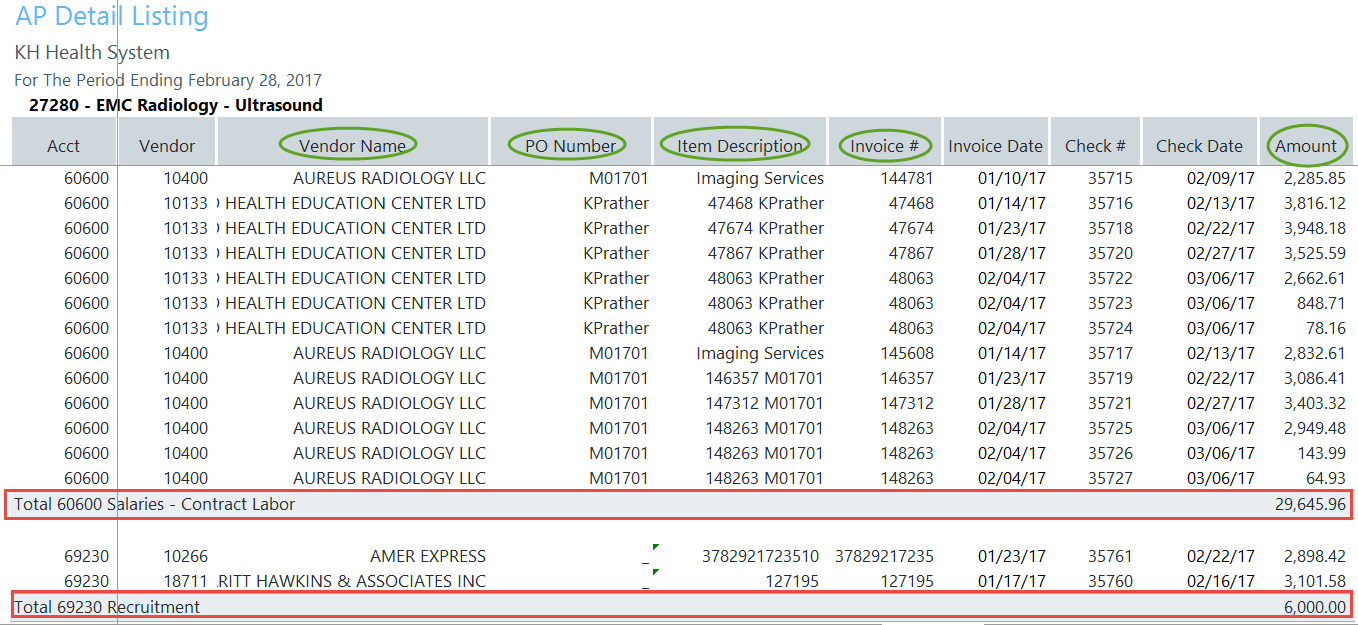
Salaries are over due to Contract Labor; only benefits were budgeted in this department.
-
In Other Expenses, the $6,000 unfavorable variance was spent on Recruitment.
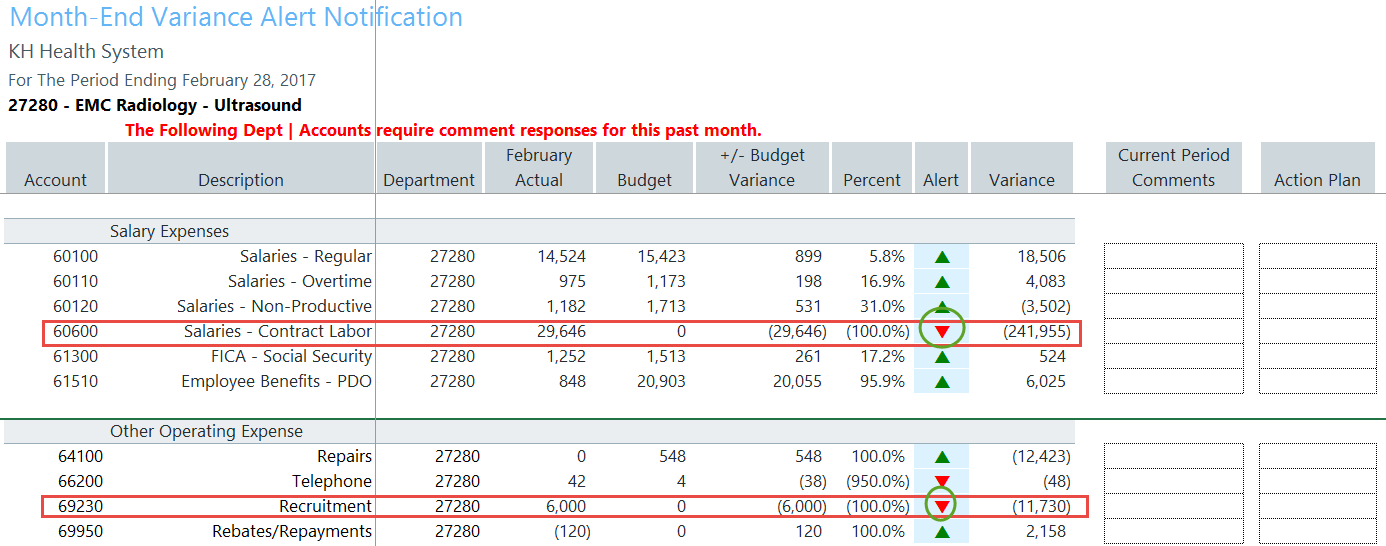
Variance Alert report (VarAlert)
The Variance Alert (VarAlert) report provides the following:
-
Variance by individual account lines provide further detail. If your organization uses the Variance Comments Collection (VCC) tool, this report highlights which accounts require a variance explanation entry.
- Displays any Variance Comments and Action Plans previously entered within the VCC tool.
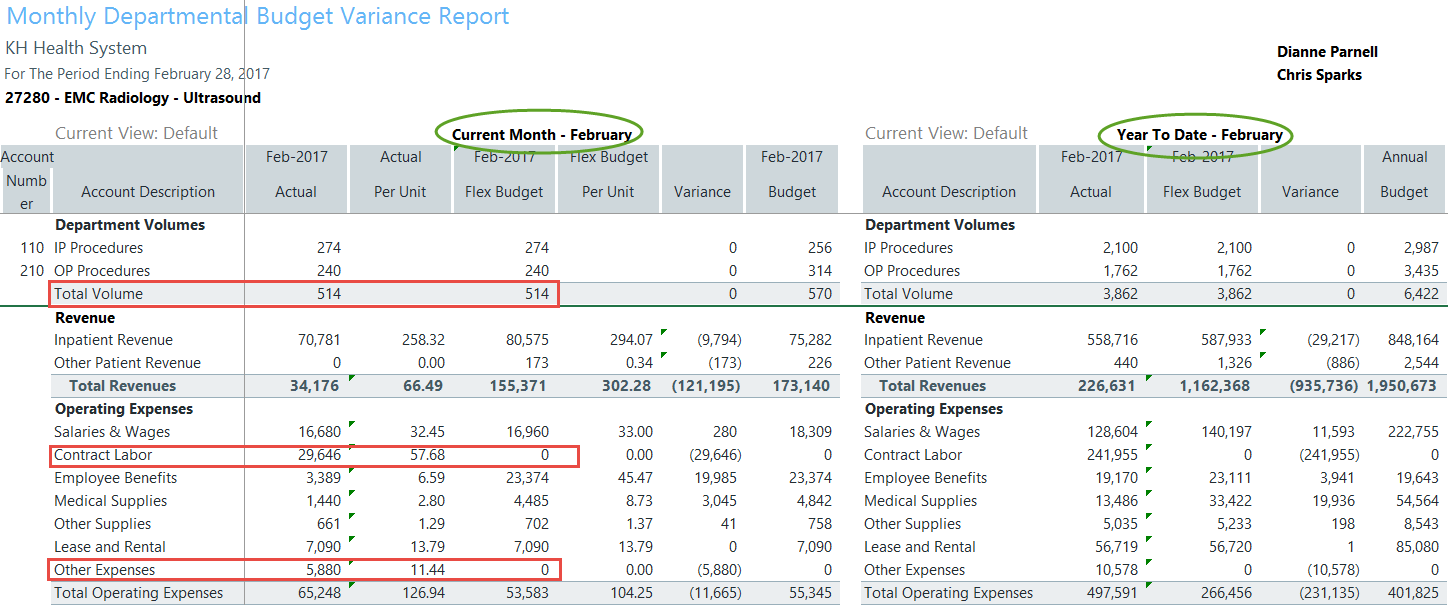
Budget Variance report (BudVar)
The Budget Variance report (BudVar) includes the following information:
- Key and supplemental statistics information
- Operating revenue and expenses
- Key per-unit calculations
- Staffing information
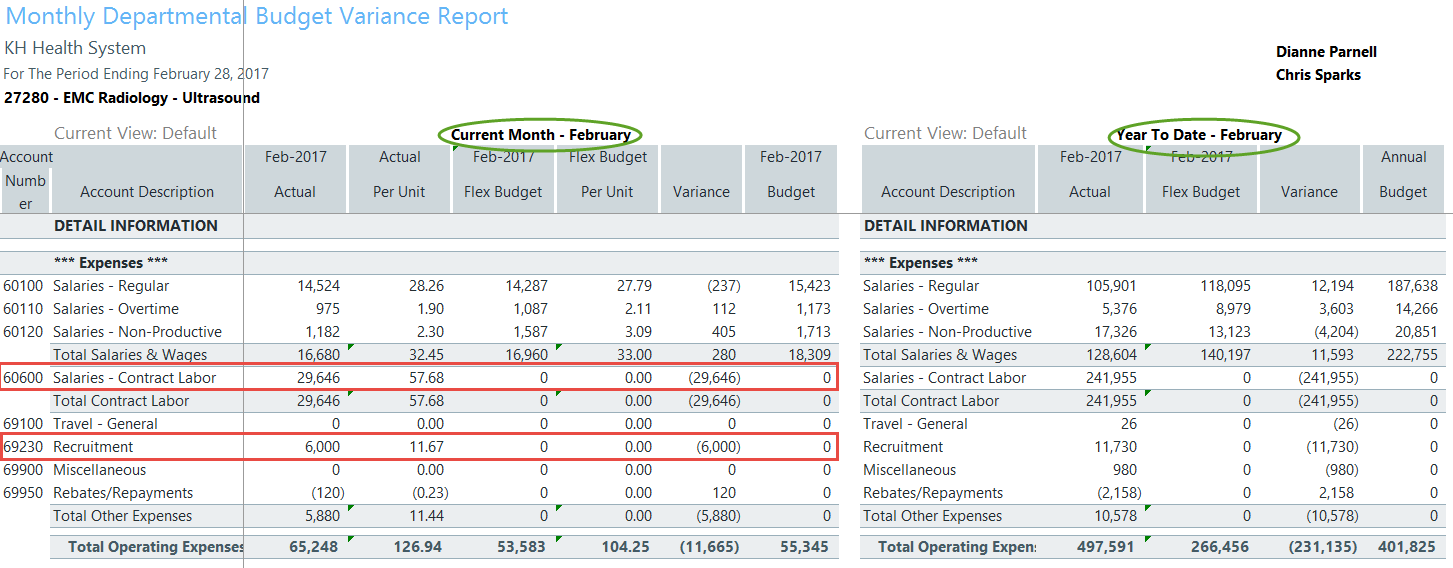
The Budget Variance Report is broken out into four sections:
- Income Statement Summary - Current Month and Year-to-Date
- Income Statement Account detail - Current Month and Year-to-Date
- Current Year Forecast Summary
- Current Year Forecast Account detail
If opened within the Axiom system, all four sections display on the same tab. If the report is delivered through email or saved on a network drive, the four sections may be presented on a single sheet or separated on four individual tabs.
Review the Summary Level information, then look to the detail for further explanation regarding variances. Determining the account numbers with variances will provide the link to the detailed information on the AP, AR, MM, etc. reports that support the expense. As in our example above, Salaries and Other Expenses resulted in a Red Flag Variance, specifically within accounts 60600 Salaries-Contract Labor and 69230-Recruitment.
The first section of the report contains Current Month and Year to Date information at a Summary level.
Below the first section is Current Month and Year to Date information, detailed by Account Number.
To the right of the first section is Monthly Trend information at a Summary Level.
To the right of the Detail for Current and Year to Date is Monthly Trend information by Account Number.
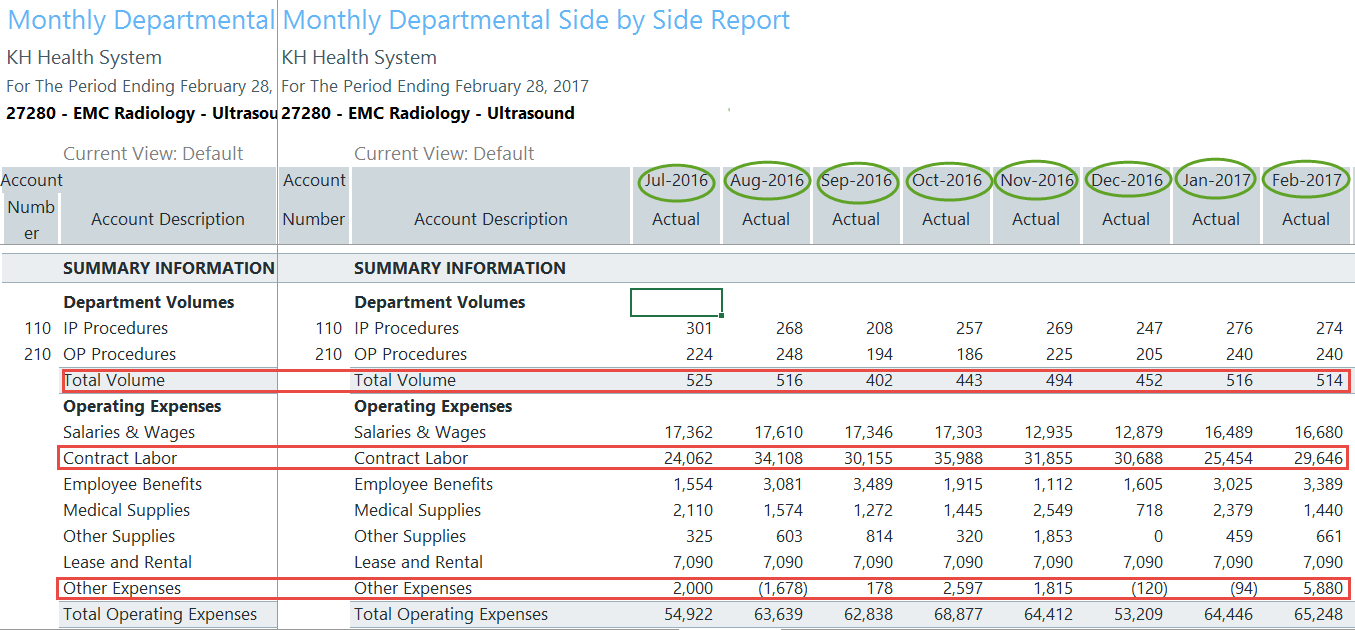
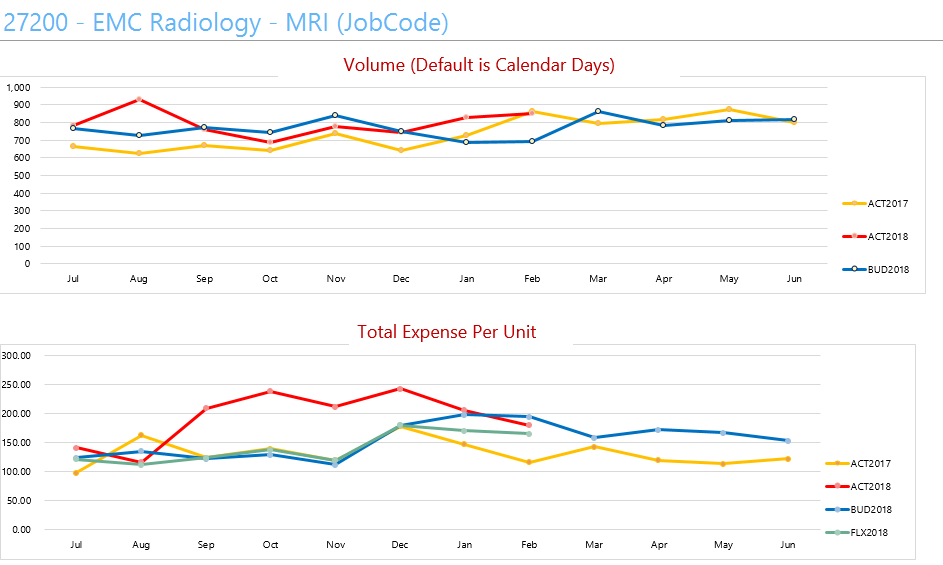
The Charts report provides an overview of comparative trends across periods for Volume, Total Expense per unit, Worked Hours per unit, and Salary Expense per unit.
Similar to the Scorecard, this report can be used to review performance trends that may require further research.
- Volume chart - Compares the department’s key statistic amounts by month for current year actual, current year budget, and last year actual
- Total Expense Per Unit chart - Compares the department’s total expense per key statistic amounts by month for current year actual, current year budget, last year actual, and current year flex budget (if used)
- Worked Hours Per Unit chart - Compares the department’s total worked (productive) hours per key statistic amounts by month for current year actual, current year budget, last year actual, and current year flex budget (if used)
-
Salary Expense Per Unit chart - Compares the department’s total salary expense per key statistic amounts by month for current year actual, current year budget, last year actual, and current year flex budget (if used)
For example, when reviewing the Volume and Total Expense Per Unit charts within the screen shot below, you will notice the following:
- The department’s current year actual key statistic volume represented by the red line has been moving in a positive direction since December, and is above the current year budget’s blue line and is equal to last year actual’s yellow line for the current month of February.
- The department’s actual total expenses per unit (key statistic volume) represented by the red line is moving in the right direction with the downward trend since December. For the current month of February the actual is slightly below the current year static budget’s blue line, and slightly above the current year flex budget’s green line.
These trends provide a couple of positive observations for the current month of February—departmental volume is above budget expectations, and total expenses per key stat are below the static budget and in line with the flex budget. The details behind these trends can be explained by reviewing the pertinent reports within this package.
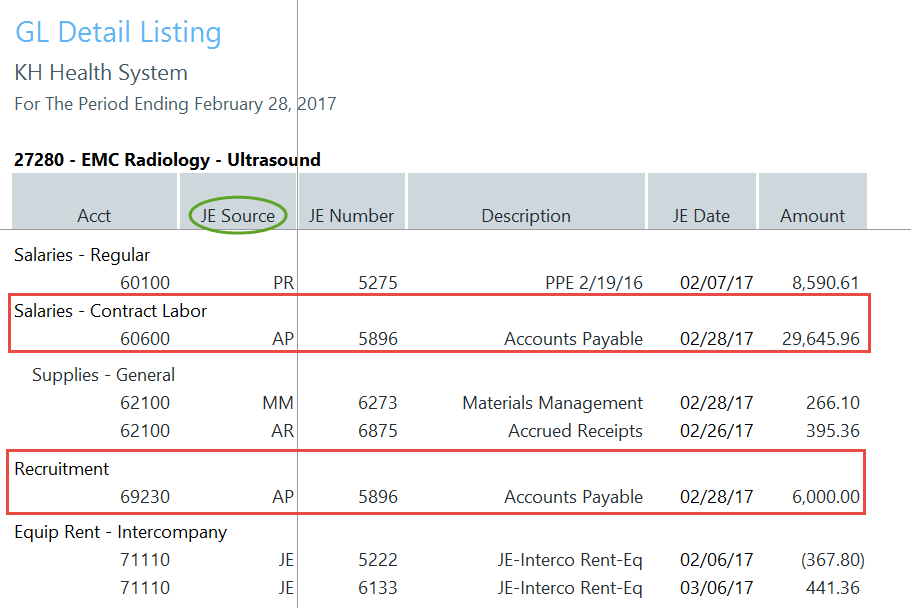
The General Ledger report (GL) contains every transaction that makes up the total dollar amount for each expense account. This report, combined with the AP, MM, and AR reports described below, helps you understand the nature of the expenses. In other words, they help you recall items purchased or services utilized for each account.
The standard JE Source codes of each GL transaction are categorized as follows (individual company source codes may vary slightly):
-
Salaries and wages come from the payroll source system and usually have a PR in the JE Source. To ensure the JE Salary dollars are in line with FTE amounts, the JC and EmpID tabs included in the reporting package allow you to review payroll hours by Jobcode and individual Employee.
-
Invoices have a JE Source of AP or accounts payable if the invoice has already been processed for payment, click the AP tab.
-
Invoices have a JE Source of AR or accrued receipts for purchase order acquisitions that have been received but have not been invoiced. For further detail of an AR expense, click the AR tab.
-
Inventory items coming from supply chain or your materials management department customarily have a MM in the JE Source. For further detail of an MM expense, click the MM tab.
-
A journal entry or JE code are expenses processed by the Accounting department. An example of a JE item would be an annual prepaid subscription. Even though the invoice for the subscription was paid in full with a single payment to the vendor, Accounting would hold the total amount and book one month’s worth of the expense to your department for each of the 12 months covered under the subscription. For further details related to JE expense transactions, please contact your assigned Finance representative.
Accounts Payable Distribution report (AP)
The Accounts Payable Distribution report (AP) comes directly from the Accounts Payable Source System and provides individual invoice information for purchases made including Description, Vendor Name, PO Number, and Amount.

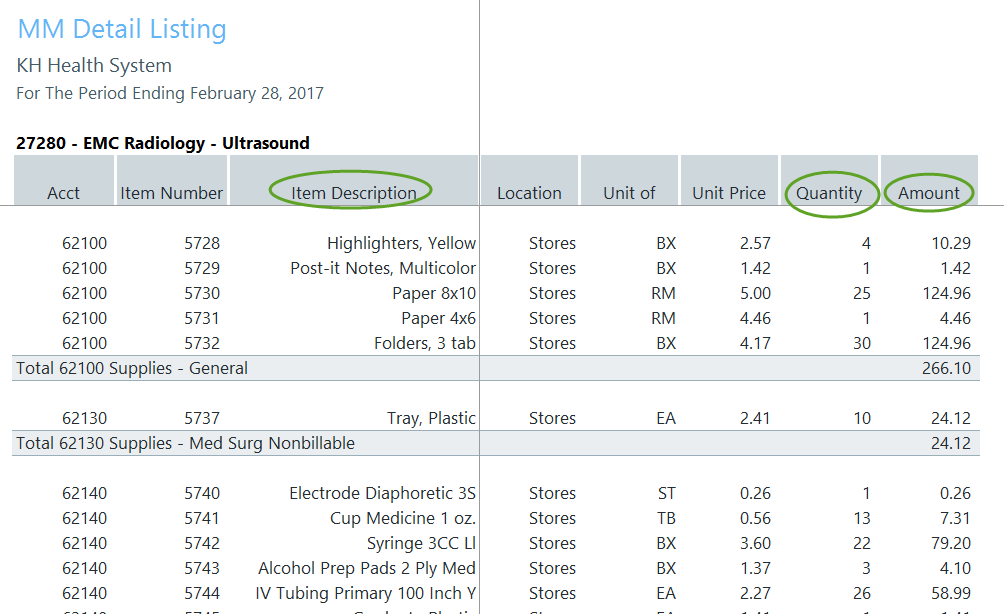
Materials Management Distribution report (MM)
The Materials Management Distribution report (MM) comes directly from the inventory system (store room) and provides transaction detail items pulled from inventory including Item Description, Quantity, and Amount.
Accounts Receipts Distribution report (AR)
The Accrued Receipts Distribution report (AR) comes directly from the purchasing system and provides purchase order detail. Items on this report have been received in your purchasing system, however, your organization has not received an invoice for the purchases. Information provided on this report includes Vendor Name, PO Number, Item Description, Invoice Number, and Amount.
Labor is typically the largest expense in healthcare organizations and thus a key component to understanding and potentially improving your department’s financial performance.
Steps and questions for reviewing labor (salaries and hours) data:
-
In the previous section you may have identified variances in salary and/or hours at a general ledger account level. The expense per unit data on those reports would let you know if the variance is related to volume. If not volume, more detail is helpful in determining whether the cause is efficiency (using more labor hours than budgeted) or rate (paying more labor dollars per unit). If the variance is due to paying more labor dollars per unit, the cause could be an issue related to:
- Staffing Mix where higher paid positions are used more than the budgeted profile (an unplanned higher use of RNs instead of LPNs); or
- Salary Rates where the individuals within the budgeted positions earning more dollars per hour than planned.
-
Review payroll data to identify variances, their causes and trend data. Useful questions include:
Overtime:
- Is overtime usage value-added or resulting from undisciplined employee clocking habits?
- Is overtime usage approved?
- Is overtime the most efficient way to leverage departmental staff vs. float employees, or could a different staffing mix be used (are there other staff members available for scheduling who would not incur overtime in given period)?
Productivity:
- Are productive hours per unit consistent with budget? If not, what is cause? Are there opportunities to flex or increase/decrease staffing with an increase/decrease in departmental volumes?
- Are salary rates per productive hour consistent with budget? If not, is staffing mix a factor (using more high cost positions than lower cost)?
Use the following reports in the Manager Monthly Package to complete the Labor Analysis:
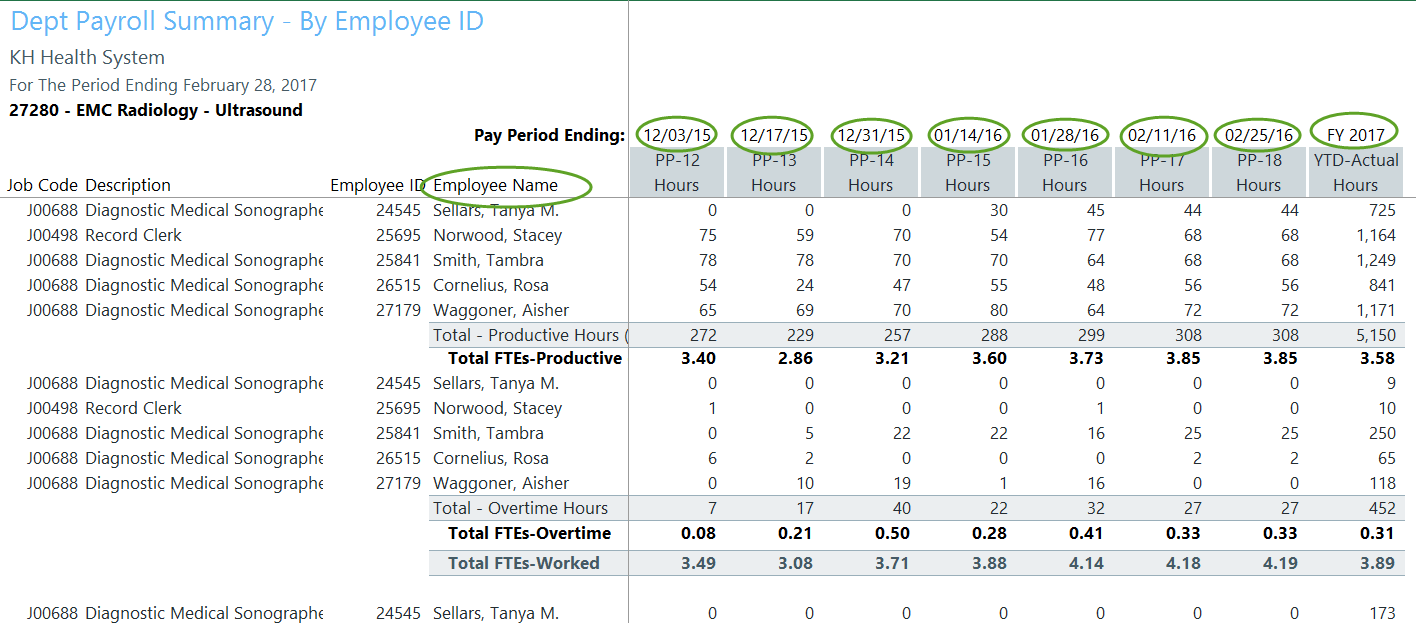
Pay by Employee ID report (EmpID)
The Pay by Employee ID (EmpID) report contains Hour and FTE information by individual Employee , including recent individual pay periods and year-to-date.
Hours are categorized by Productive, Overtime, and Non Productive categories.
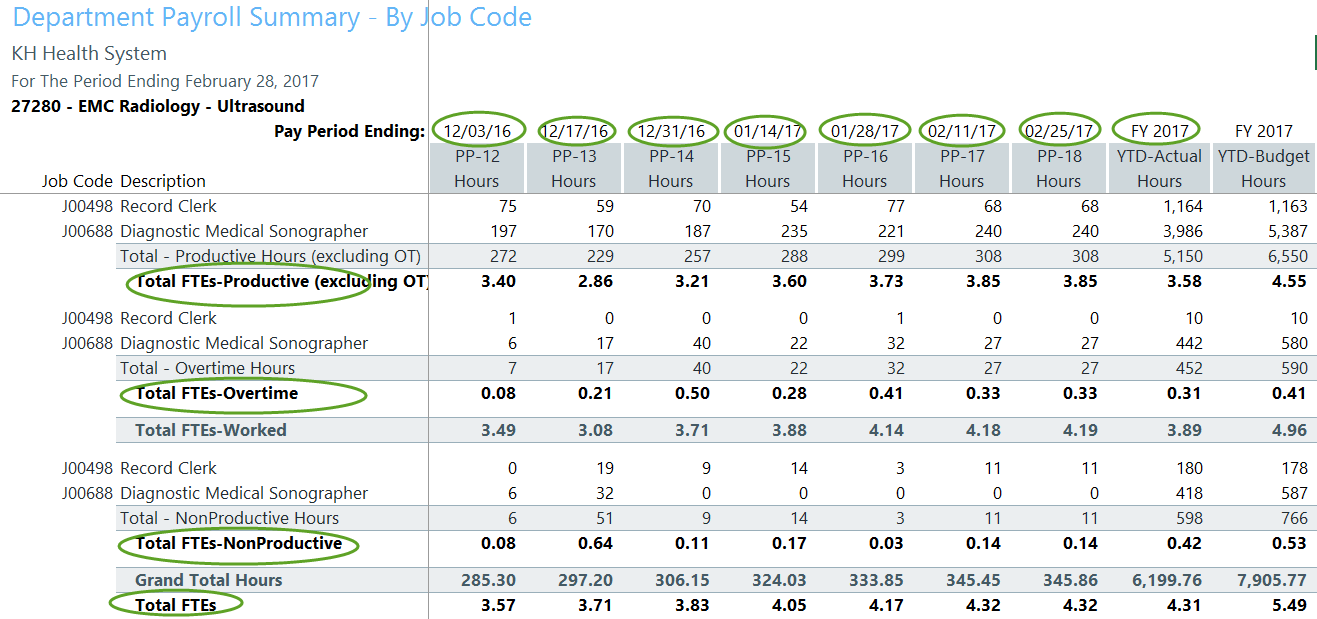
The Pay by Job Code (JC) report contains Hour and FTE information by individual Jobcode , including recent individual pay periods and year-to-date.
Hours are categorized by Productive, Overtime, and Non Productive categories.