Readmission Analysis report
Overview
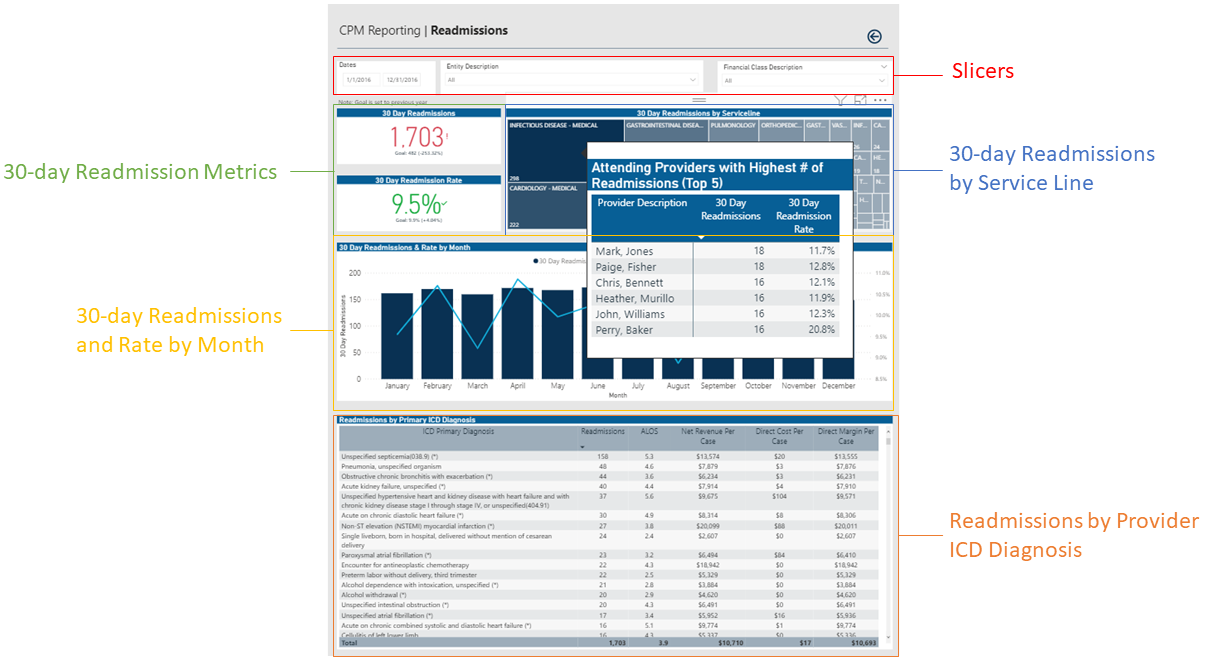
This report provides KPI metrics and details regarding readmission rates at your organization and across service lines. To return to the Inpatient Executive Summary Dashboard, click the arrow in the upper right corner.
Click image to view full size
Opening the report
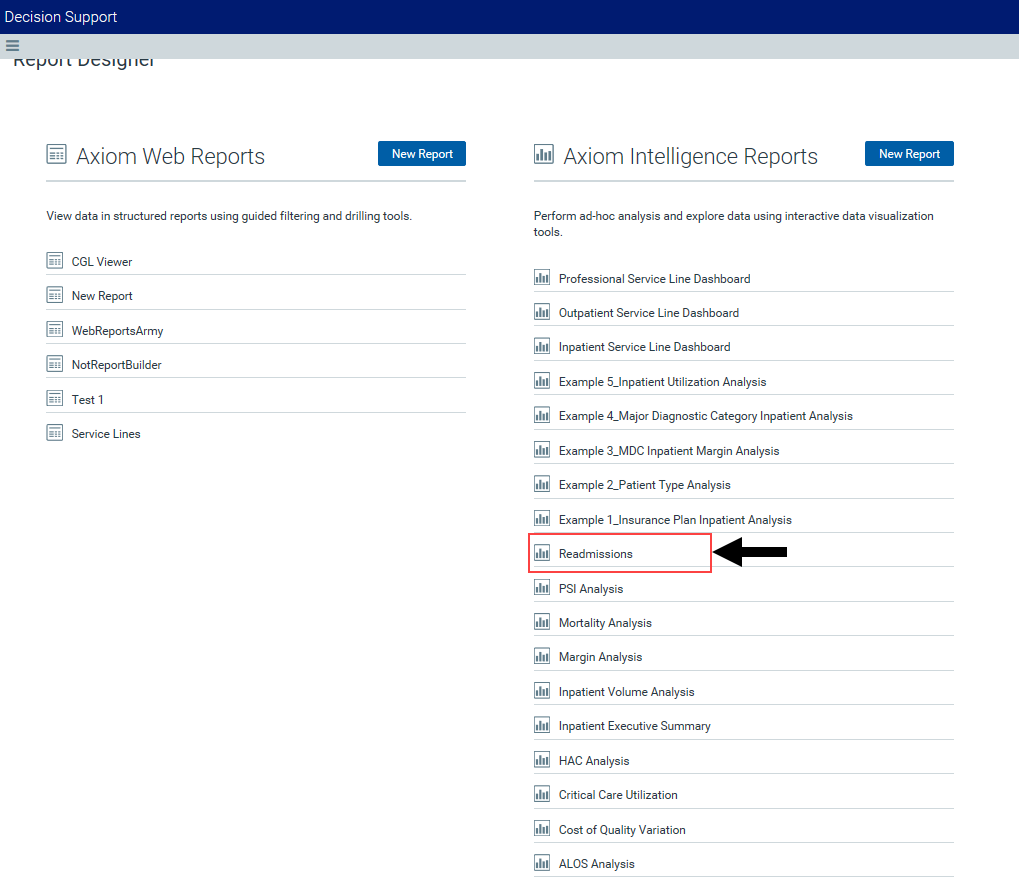
TIP: You can open this report individually or through the Inpatient Executive Dashboard.
To open the dashboard:
- Open Axiom Report Designer in the Web Client.
-
In the Axiom Intelligence Reports section, click Readmissions.

Click image to view full size
Slicers
This section allows you to filter data by date range, entity, and financial class. From the drop-downs, you can select a combination of the available options to define the data parameters to include in the report.

Click image to view full size
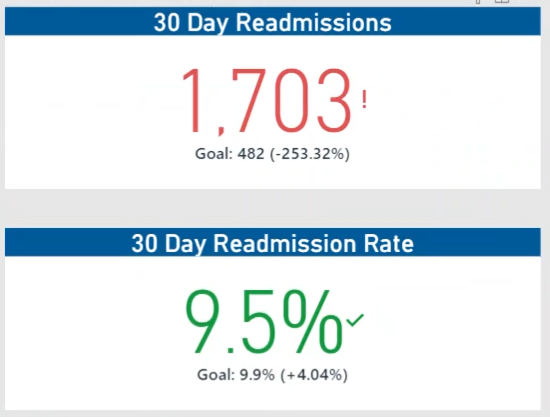
30 Day Readmissions and Rate
This section shows the number of readmissions and the readmission rate, including goals set up in the previous year.
Click image to view full size
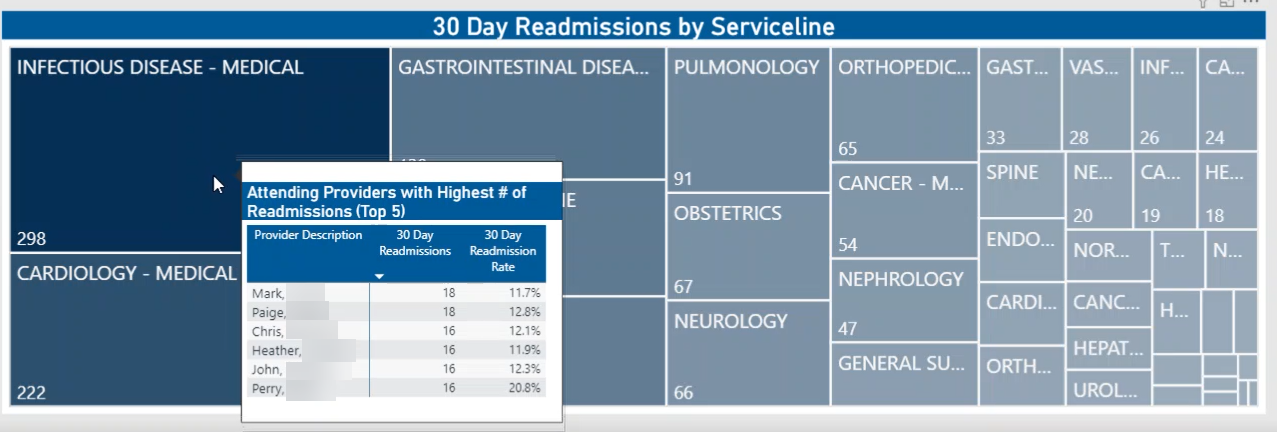
30 Day Readmissions by Service Line
This section allows you to view the providers and their readmission rates by hovering your cursor over a service line square. When you click a square, the system greys out the details across the page except for data specific to the service line you selected. To enable all of the data across service lines on the page again, click the square again.
Click image to view full size
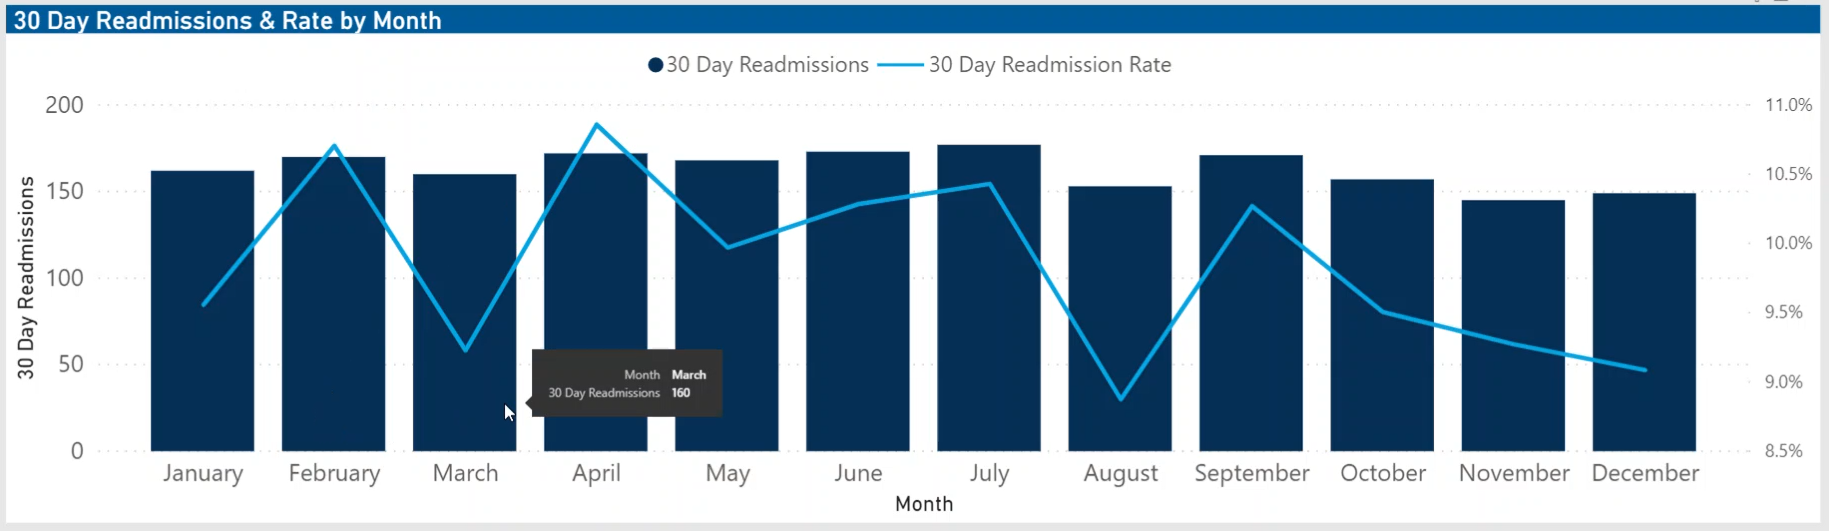
30 Day Readmissions by Rate and Month
This section displays a bar chart that shows the number of readmissions for each month for the date range selected in the Slicer section above. The chart also shows the readmission rate trend across months.
Click image to view full size
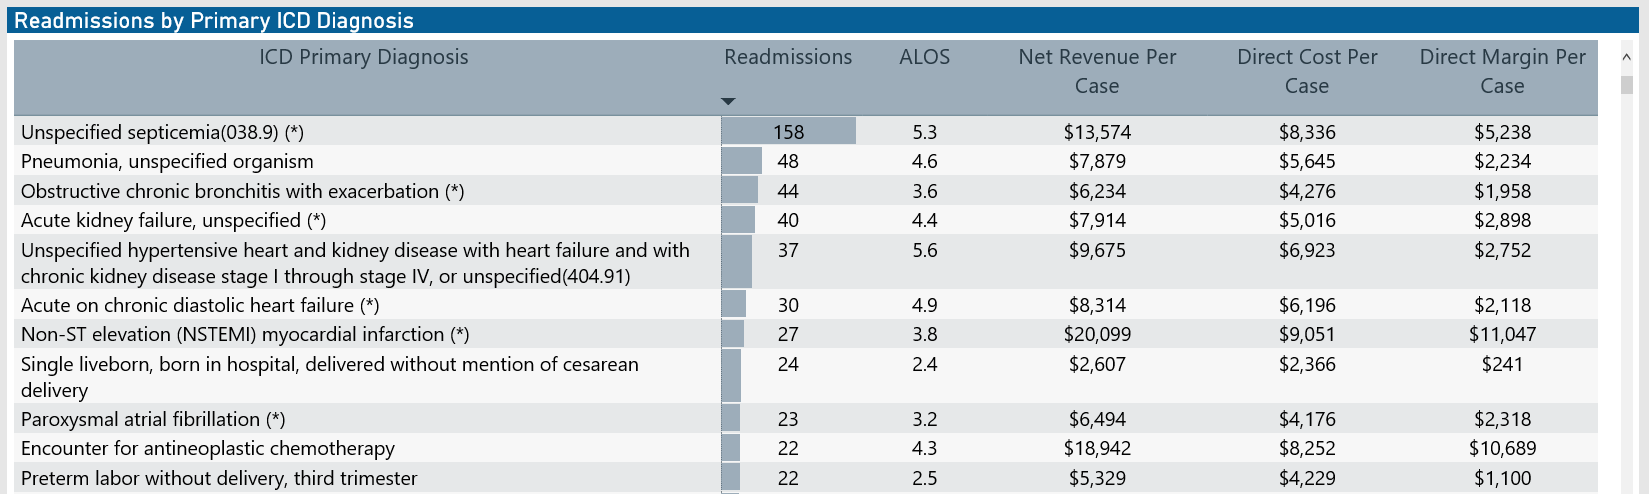
Readmission by Primary ICD Diagnosis
This section shows the details regarding readmissions by primary ICD Diagnosis to help you understand under what circumstances patients are returning, including the number of readmissions, ALOS, net revenue per case, direct cost per case, and direct margin per case.
Click image to view full size
From this section, you can do the following:
-
View the details for a specific diagnosis by clicking a row. The system greys out the details for the other diagnoses across the page except for data specific to the diagnosis you selected.
-
Sort the table by columns in ascending or descending order by clicking the column header.
-
Drill up or down through the data by right-clicking the row, and then selecting Drill Up or Drill Down.
Including or excluding data
From some visualization charts and tables, you can exclude data by right-clicking the image or table row, and clicking Exclude. To show only one data element in the visualization or table, right click the image or a table row, and click Include.
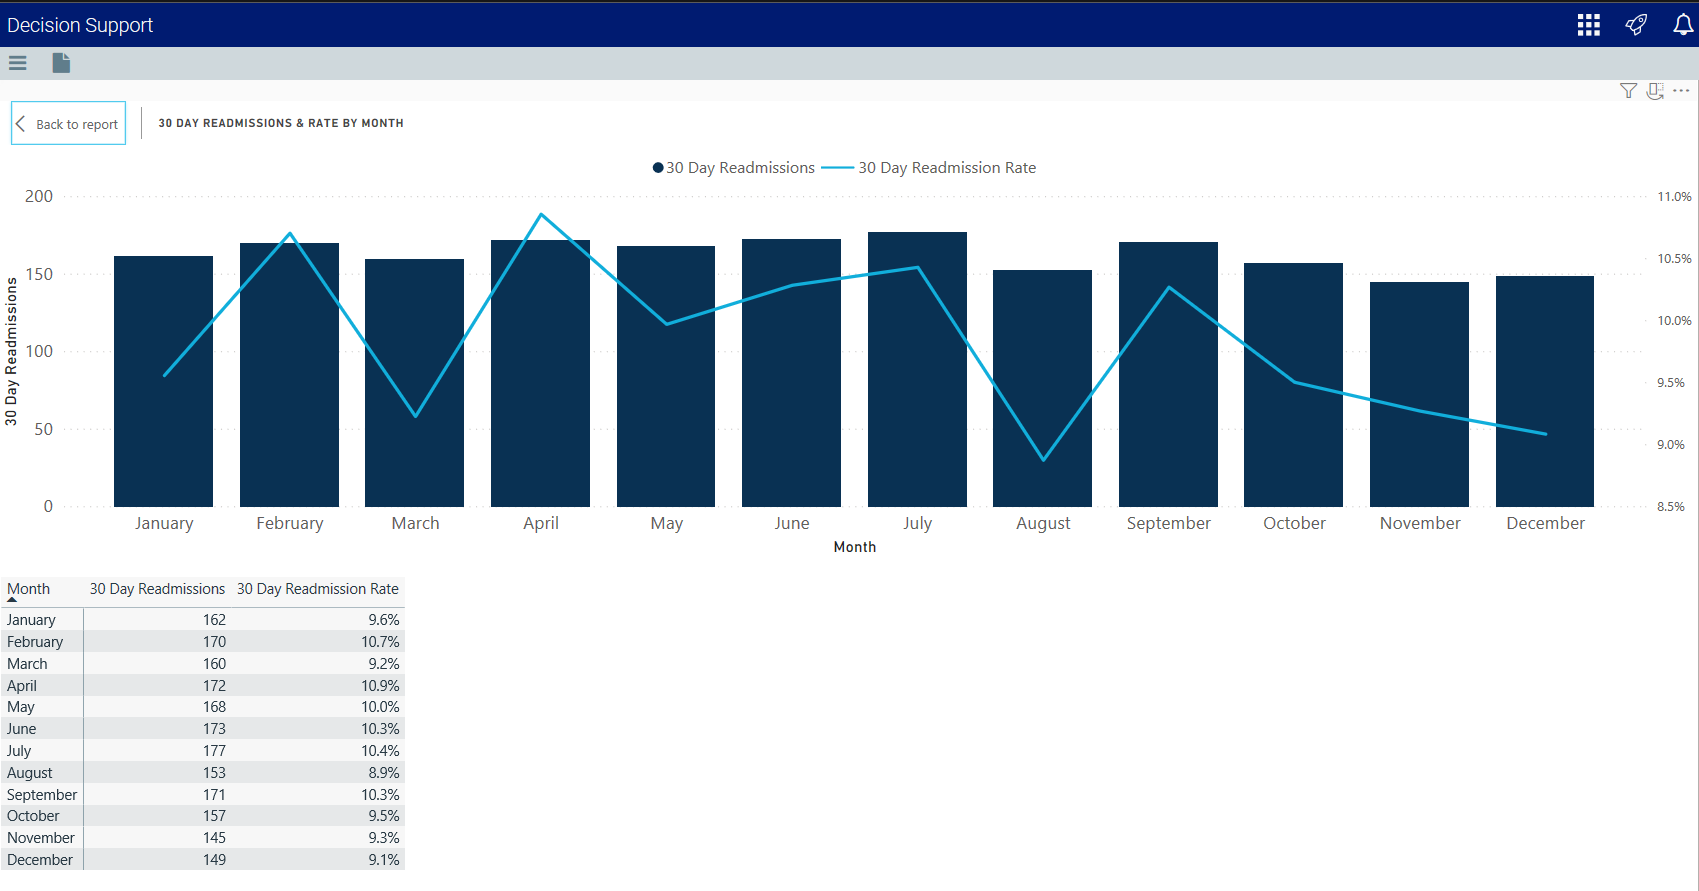
Viewing data
You can view the underlying data for visualization graphs and tables by right-clicking the image or table, and clicking Show Data. A data table displays underneath the visualization graphic or table. To return to the dashboard, click Back to report in the upper left corner of the page.
Click image to view full size
Copying data for other reports
If you have permissions to edit or create Axiom Intelligence reports, you can copy visuals to create a new report. For tables, you can also copy values and selections.
To copy, right-click in the section, and select Copy Visual, Copy Selection (tables only), or Copy Value (tables only).
NOTE: This function only applies to users that have permission to edit and manage Axiom Intelligence reports.
