Inpatient Executive Summary dashboard
Overview
This dashboard displays KPI views of clinical and financial data to help inform and drive decision making for executives.
NOTE: This dashboard is only accessible if your organization has a license for Axiom CPM.
Opening the dashboard
TIP: Along with the dashboard, you can also access the individual reports that make up the dashboard.
To open the dashboard:
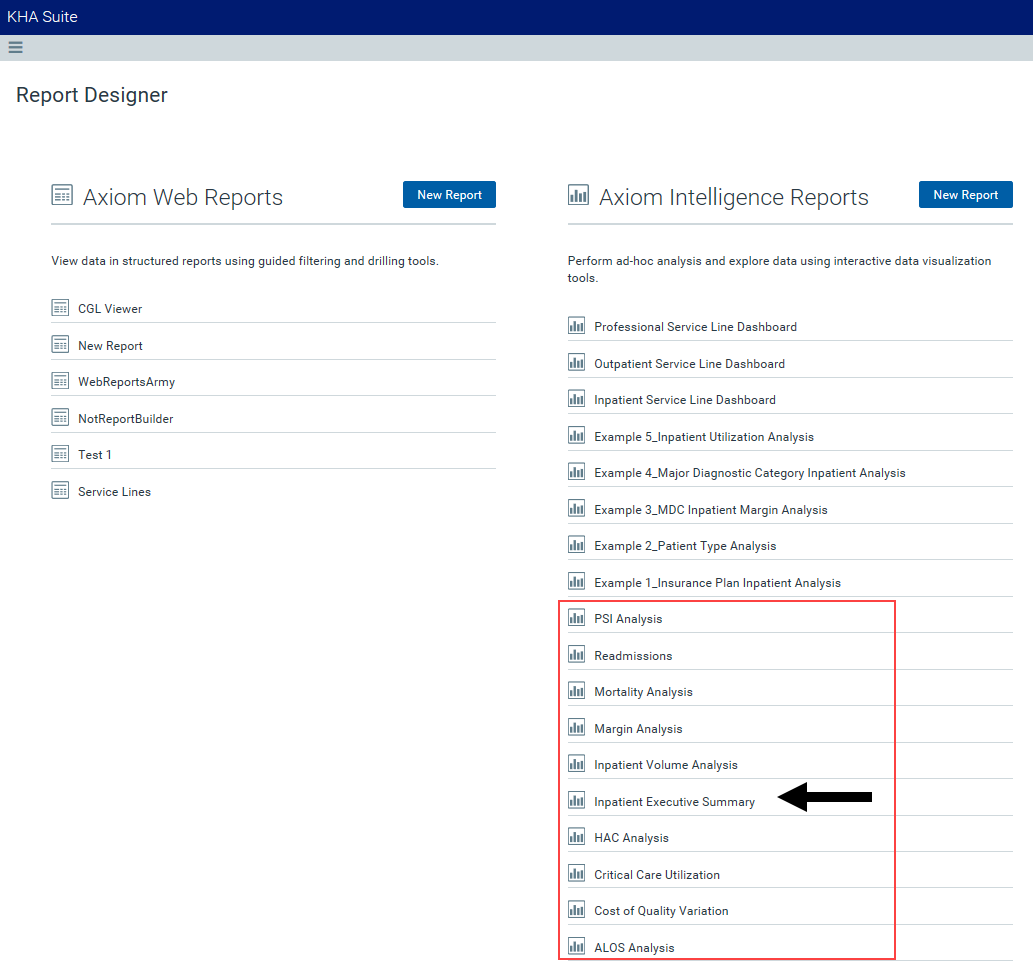
- Open Axiom Report Designer in the Web Client.
-
In the Axiom Intelligence Reports section, click Inpatient Executive Dashboard.

Click image to view full size
Navigating the dashboard
The dashboard includes two main sections: Slicers and KPI data cards
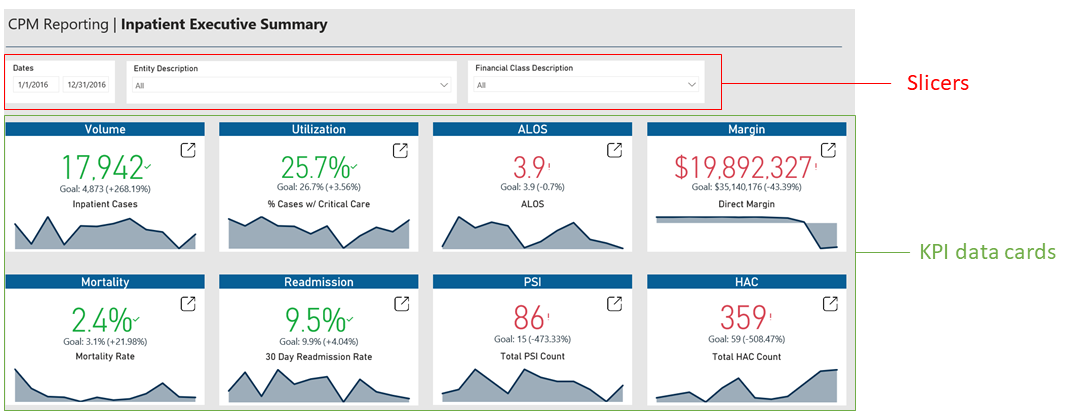
Click image to view full size
Slicers
This section allows you to filter data by date range, entity, and financial class. From the drop-downs, you can select a combination of the available options to define the data parameters to include in the dashboard.

Click image to view full size
KPI data cards
Each KPI data card provides current year data, the goal set in the previous year, and what the data is measuring. The amount of data is based on the date range you selected in the Slicer section.
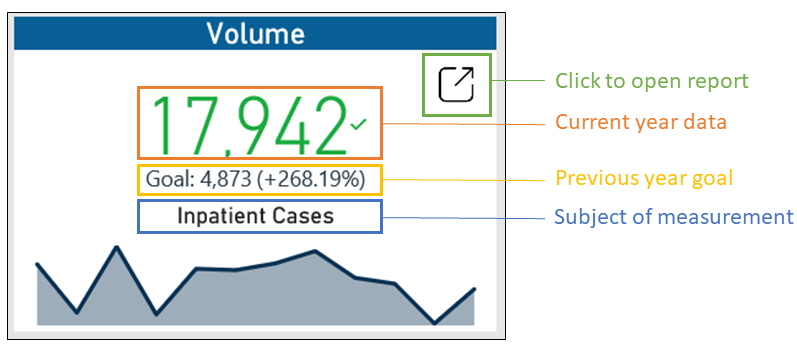
The card is interactive so that you can view KPI data throughout the date range. Hover your cursor over the graph at the bottom of the card to view a tool tip of the data specific to a month. When you click on the graph, the current year data and goal percentage in the parentheses will adjust to the selected time period.
The red and green font indicate where there are problems, which you can investigate further by drilling down into the specific reports that supply data for each card. Click the box in the top right corner to open the report used to generate the KPI data. Click the following links to view more information about the KPI report.
