AX1194
Axiom forms support a variety of options to display reporting data within the form. The appropriate option for any particular form depends on the type of data that you need to display, the display requirements, and the additional features that you need to make available to users—such as sorting, filtering, grouping, drilling, and user inputs.
The following components can be used to display reporting data:
-
The Data Grid component queries data directly from the database, and displays it in a standardized data grid. This option provides many built-in features for users to review the data, but offers limited formatting options.
-
The Fixed Report component queries data directly from the database, and displays it within a fixed-row structure. The report structure can include multiple sections with headers, subtotals, and totals, including the ability to individually define the data to be shown in each row. This option provides a high level of control over the report structure, but offers limited formatting options and limited features for users to review the data.
-
The Formatted Grid component displays data from the source spreadsheet. This option provides robust formatting and user input features.
Generally speaking, Data Grid and Fixed Report components should be used to display reporting data, and Formatted Grid components should be used to gather data inputs. However, Formatted Grid components can also be used to display reporting data, in cases where advanced query structures or complex formatting is needed.
In the Form Designer, all of these components are available in the Form Controls section along the left-hand side of the screen.
Data Grid component
The Data Grid component provides the ability to display data from the database in a standardized grid within an Axiom form. The columns to be displayed in the grid are defined by placing a DataGridColumns data source in a sheet. When the grid is rendered in the Axiom form, it queries data from the database based on the component settings and the columns listed in the data source. This direct database query is much more efficient than reading data from the source spreadsheet, and provides better report performance as compared to a Formatted Grid component.
Data Grid components use a standard format that provides a consistent user experience across all forms where it is used. The grid provides built-in tools for paging, filtering, sorting, and drilling data. Data can also be displayed in expandable/collapsible groupings. Although this standardized grid provides many options for users to explore the data, it does not support formatting options or fixed-row report structures. It is a simple and direct view of the data, as opposed to a formatted and structured view.
Although Data Grid components are primarily for data display, they do support some interactivity. Icons can be displayed in the grid and can optionally be used to trigger certain commands or open a designated URL. Data grids can also be used as selector tools, to change the form in some way based on the currently selected row in the grid.
Example Data Grid component with grouped data
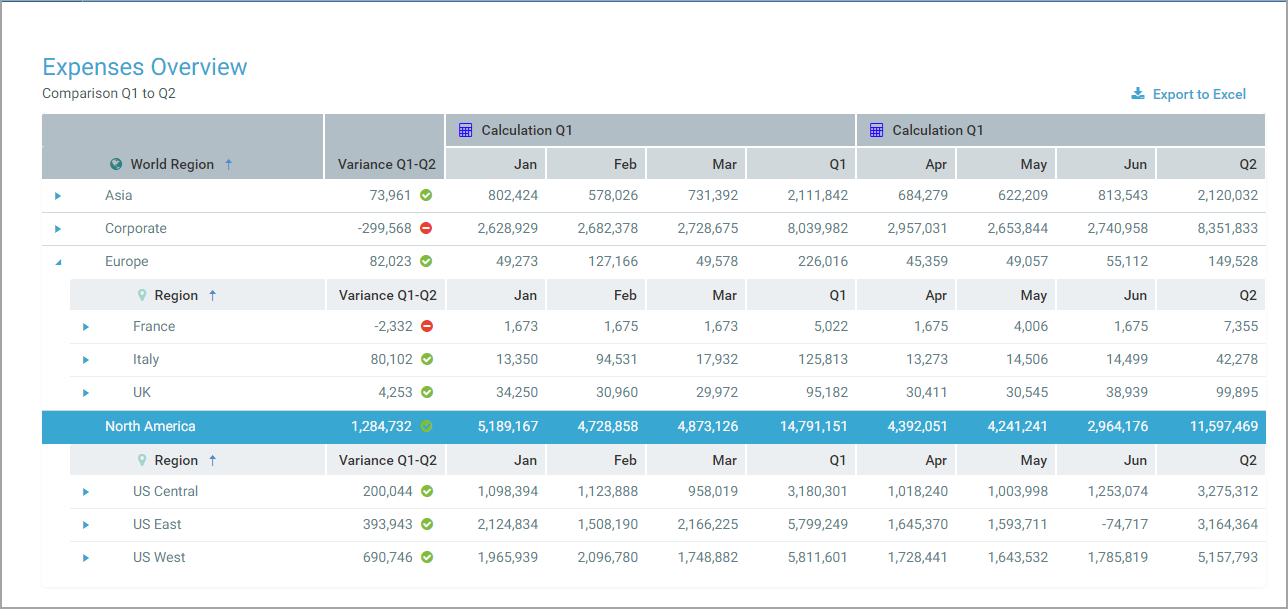
Fixed Report component
The Fixed Report component provides the ability to display data from the database within an Axiom form, using a fixed-row report structure. Using various data sources in the source spreadsheet, you define the columns to be displayed in the report and you define the report row structure. When the report is rendered in the Axiom form, it queries data from the database based on the component and data source settings. This direct database query is much more efficient than reading data from the source spreadsheet, and provides better report performance as compared to a Formatted Grid component.
Fixed Report components are similar to Data Grid components in how they query data, but Fixed Report components provide a much greater level of control over the report structure. You can define as many fixed row sections as needed, with headers, subheaders, totals, and subtotals. You can explicitly define which rows to show in each section, and what data should be used to populate each row. The different components of the report are automatically formatted (such as shading and borders on subtotal and total rows), but at this time the formatting cannot be customized.
Due to the greater flexibility in report structure, Fixed Report components do not support the same built-in data viewing tools as Data Grid components. Fixed Report components do not have built-in sorting, filtering, or grouping. However, built-in drilling is still supported.
Although Fixed Report components are primarily for data display, they do support some interactivity. Icons can be displayed in the report and can optionally be used to trigger certain commands or open a designated URL. Fixed Report components can also be used as selector tools, to change the form in some way based on the currently selected row in the report.
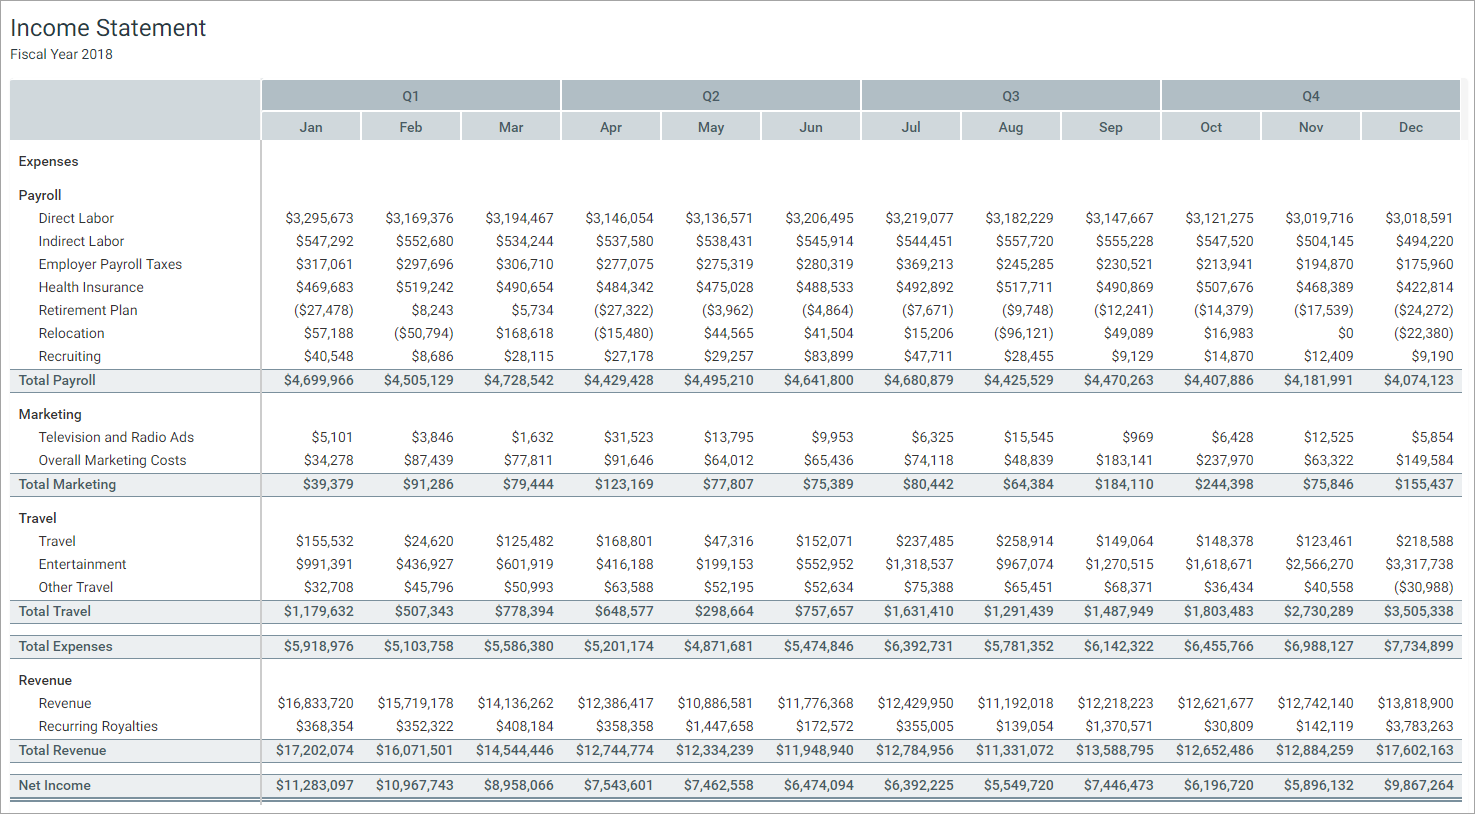
Example Fixed Report component
Formatted Grid component
The Formatted Grid component provides the ability to display information in a formatted grid structure within an Axiom form. The contents to be displayed in the grid are defined by placing a Grid data source in a sheet. You then populate the rows and columns of the data source with the information that you want to display in the grid, and apply styling to the rows and columns to determine the formatting of the contents. In addition to displaying text and numbers, special content tags can be used in the grid in order to display controls such as text boxes, combo boxes, and buttons within the grid cells. Each Formatted Grid component in a form can look and act very differently depending on the formatting applied to the contents and the features used within the grid.
The Formatted Grid component does not query data itself; it simply displays data that was brought into the source spreadsheet. In order to display data from the database, you must use features such as Axiom queries, data lookups, and Axiom functions to bring data into the spreadsheet, then tag that data for display in the Formatted Grid component. This is less efficient than the direct data queries used by the Data Grid and Fixed Report components, and may result in slower report performance. However, Formatted Grid components are also more flexible and may be able to meet certain design needs that cannot be met by the other components.
Because Formatted Grid components do not query data directly and instead display data from the spreadsheet, they do not support any built-in data viewing tools such as sorting, filtering, and grouping. However, in many cases, it is possible to manually build similar solutions by using interactive components in the form to impact the data queries in the spreadsheet or the tagged contents of the grid. Also, Formatted Grid components do support drilling, but they require additional setup to make the drilling work.
Formatted Grid components can be used in many different ways to support data inputs and other interactivity. For example, grids can be used as follows:
- As selector tools, to change the form in some way based on the currently selected row in the grid.
- As input grids, with controls such as text boxes, check boxes, and drop-down lists all presented directly within the cells of the grid.
- As navigation tools, to present lists of hyperlinks to other files and forms.
- As reports, to display data using flexible structures and all available data query tools
Formatted Grid components also support special features, such as a full symbol library for use in grid cells, the ability to display sparkline charts and bullet charts inline with data, and the ability to edit grid data in a spreadsheet interface.
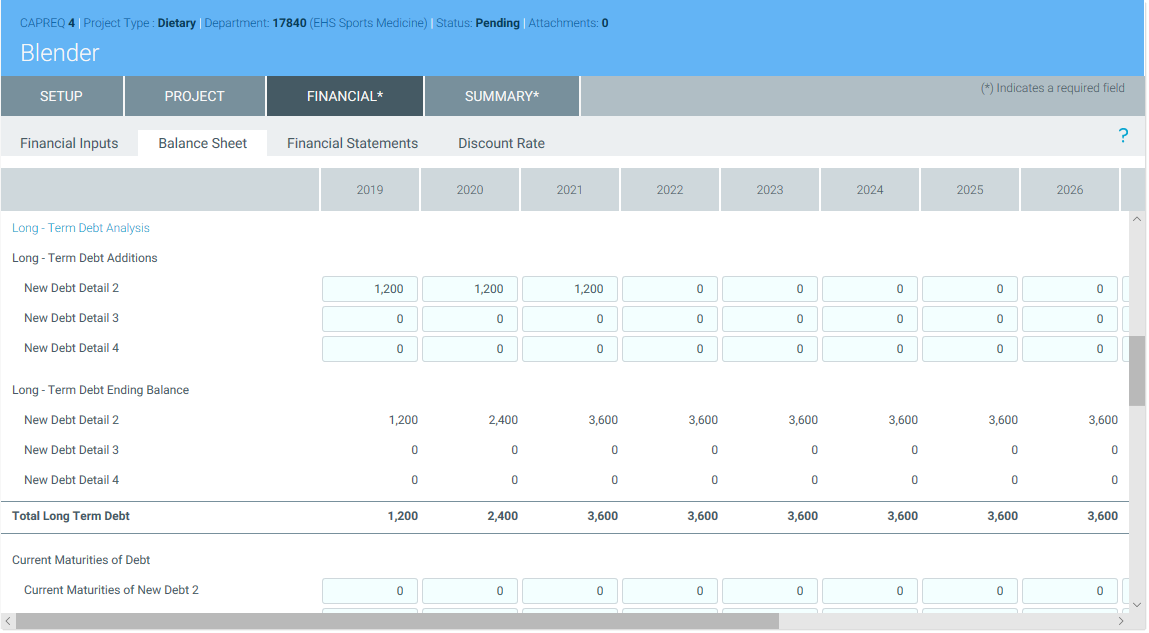
Example Formatted Grid with user inputs
Comparison
The following table compares the three options:
| Features | Data Grid | Fixed Report | Formatted Grid |
|---|---|---|---|
|
Optimized data query |
Yes | Yes | No |
| Built-in user sorting | Yes | No | No* |
| Built-in user filtering | Yes | No | No* |
| Drilling | Yes | Yes | Yes |
| Expandable / collapsible data groupings | Yes | No | No* |
| Formatting options | No | No | Yes |
| Fixed report structure | No | Yes | Yes |
| Icons | Yes | Yes | Yes |
| User inputs / saving data to database | No | No | Yes |
| Execute commands | Limited | Limited | Full |
* Although the Formatted Grid component does not provide built-in features for user sorting, filtering, and data grouping, it is possible to build these features using other form functionality. For example, if you want the user to be able to change the sort of the data in the grid, you could build a drop-down list of sorting options, and then apply the user's selection to the Axiom query that is being used to generate the data for the Formatted Grid component.
