AX2091
Axiom grids
Axiom grids are used in dialogs throughout Axiom Software, to display lists of information. These grids offer many ways to group and filter the information.
You can change the order of columns by dragging and dropping, and you can sort by clicking a column header.
Filtering the list
Filtering can be especially helpful when you need to select items to include in a utility or other process. Generally, you can filter the list to show a subset of items, and then select only the items that are shown in the dialog.
To filter a column, click the down arrow button ![]() in the column header. This brings up a grouping and filtering dialog for the column.
in the column header. This brings up a grouping and filtering dialog for the column.
The filtering options depend on the type of column. Use one of the following:
- Equality: Select a value to show items that exactly match that value. You can select multiple values to match.
- Contains: Type a value to show items that contain that value. For example, to show all departments with the text "Overhead" somewhere in the name.
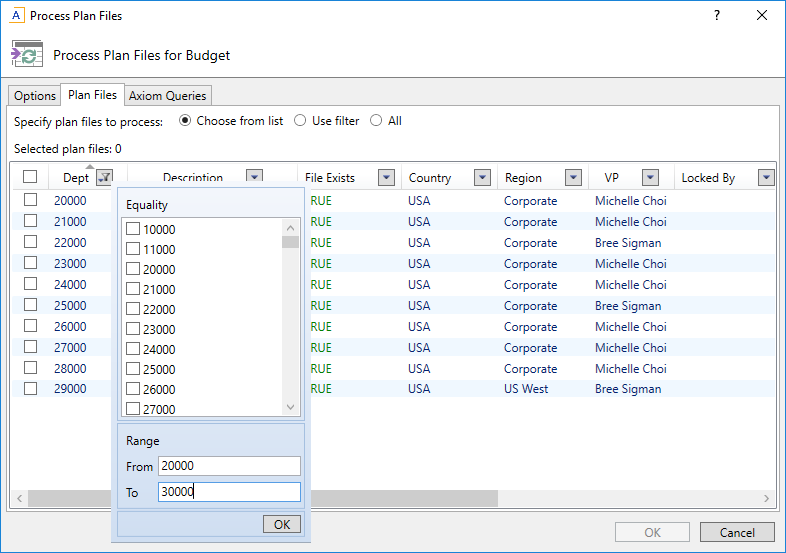
- Range: Specify a range of values to show items that fall within the range (inclusive). For example, to display all departments from 20000 to 30000.
Columns are filtered as soon as you select a filtering option. The OK button on the grouping and filtering dialog is only to close the dialog. You can press the ESC key to close the dialog and cancel the filter.
Once a column is filtered, the arrow button changes to show a filter icon ![]() , so that you know the contents of the column are filtered. You can define filters for multiple columns.
, so that you know the contents of the column are filtered. You can define filters for multiple columns.
To clear a filter for a single column, click the filter button in the column header, and then click Clear Filters. To clear all filters, right-click in the column header and select Clear All Filters.
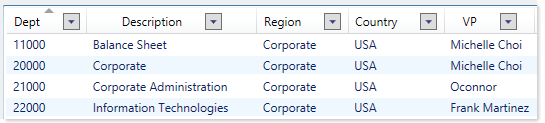
For example, if you want to filter the list to show a specific subset of departments, you could set a range as follows:
If you only want to run the utility on this subset of departments, you can select the check box in the header, and only the displayed departments will be selected.
If all of these departments belonged to the same region, or had the same VP, you could achieve the same effect by filtering on the Region or VP column, but this time selecting a specific region or VP to filter the list.
Grouping the list
To group the information by a column, click the button in the column header (it is either an arrow button or a filter button, depending on whether the column has been filtered), and then click Group By.
The list is grouped by the selected column:
- To expand a grouping and see the items in a group, click the down arrow by a group name.
- To contract a grouping and hide the items in a group, click the up arrow by a group name.
Once the list has been grouped, a group icon appears in the column header ![]() (not on the button) to signal which column the list is grouped by. Only one level of grouping can be applied; if you choose to group by a different column, then the current grouping is cleared and the new grouping is applied.
(not on the button) to signal which column the list is grouped by. Only one level of grouping can be applied; if you choose to group by a different column, then the current grouping is cleared and the new grouping is applied.
To clear a grouping, click the button in the column header of the grouped column, and then click Clear Grouping. You can also right-click the column header and select Clear All Groupings.
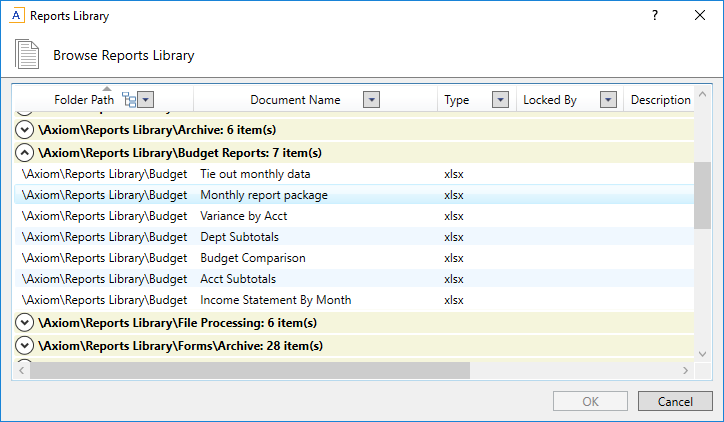
For example, you could group the Browse Reports Library dialog by folder path:
Hiding and showing columns
In most grids, you can hide columns and you can display additional columns.
-
To hide a column, right-click the header for that column, and select Hide ColumnName. You cannot hide a column if it is the key column for the list.
-
To show a column, right-click anywhere in the column header to bring up the list of available columns, and then select the desired column to add it to the grid. You can also hide columns using this list, by clearing the check box next to the name of the column that you want to hide.
Column changes apply to the current dialog session only. The next time that you open the dialog, the default columns display.
