AX1262
When using a Map View component, the actual map graphic displayed on the Axiom form is defined by one or both of the following items:
-
A GEO Feature File can be used to define "features" (shapes) to display on the map view. For example, the GEO Feature File can define the shapes of countries, states, or counties, or any geospatial construct such as the sales territories used by your organization or a representation of the London tube lines. These features can display on the map "as is," or you can add feature rows to your MapView data source to define display properties for the features.
- A Map Tiles Provider can be used to display a background map tile on the map view. The level of detail on the map tile depends on the selected provider. The map tile is always displayed "as is" and cannot be formatted by the data source or selected for interactivity.
Deciding how to define your map graphic
When deciding how to define the map graphic for a Map View component, you should consider factors such as the following:
-
How much detail do you need to display on the map? For example, if you want users to be focused solely on the map markers and features, then you may want to use only a GEO Feature File so that users aren't distracted by extraneous details on an all-purpose map tile such as cities, roads, and rivers.
-
Do users need to select feature areas on the map, or just plotted locations? If users only need to be able to select specific plotted locations on the map, then you can choose to use only a map tile as the map graphic. However, if users need to be able to select specific feature areas such as a state or a country, then you must use a GEO Feature File to define these features and make them selectable on the map.
-
Are the features you need to display available on an all-purpose map? Map tiles generally display standard geographical features and governmental entities like rivers, lakes, states, and cities. If the features you need to display on the map are more specialized, such as your organization's specific sales territories, then you must use a GEO Feature File to define the parameters of these features.
-
How important is it that the map be cosmetically appealing? Map tiles give the map graphic a lot of color, depth, and other visual interest. If it is very important that the map graphic "looks attractive" versus just being useable, you may want to use a Map Tile either alone or in conjunction with a GEO Feature File.
The ability to zoom in and out and move the map graphic is available regardless of which approach is chosen.
The following example screenshots illustrate how Map View components can look and behave differently based on whether the component only uses a GEO Feature File, or only a Map Tiles Provider, or both. In these screenshots, one example location (a Pin row) is defined in the data source.
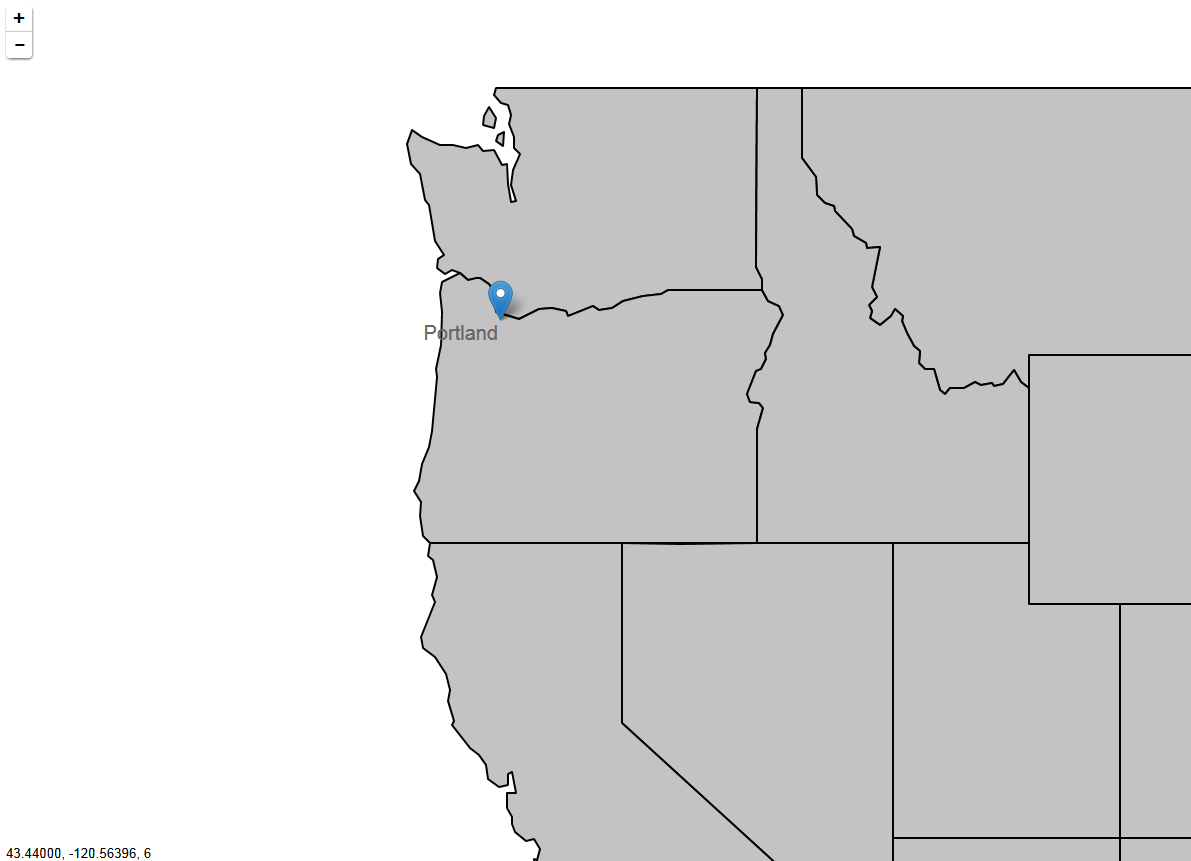
GEO Feature File only
In this example, a GEO Feature File is used to define the state "features" (shapes). No Map Tile provider is specified. When using this approach, the map can be interactive based on selecting plotted location points from the data source (as shown using a pin in this example) or by selecting individual state shapes. You can also define display properties for the state features such as fill color, border color and thickness, label text, etc.
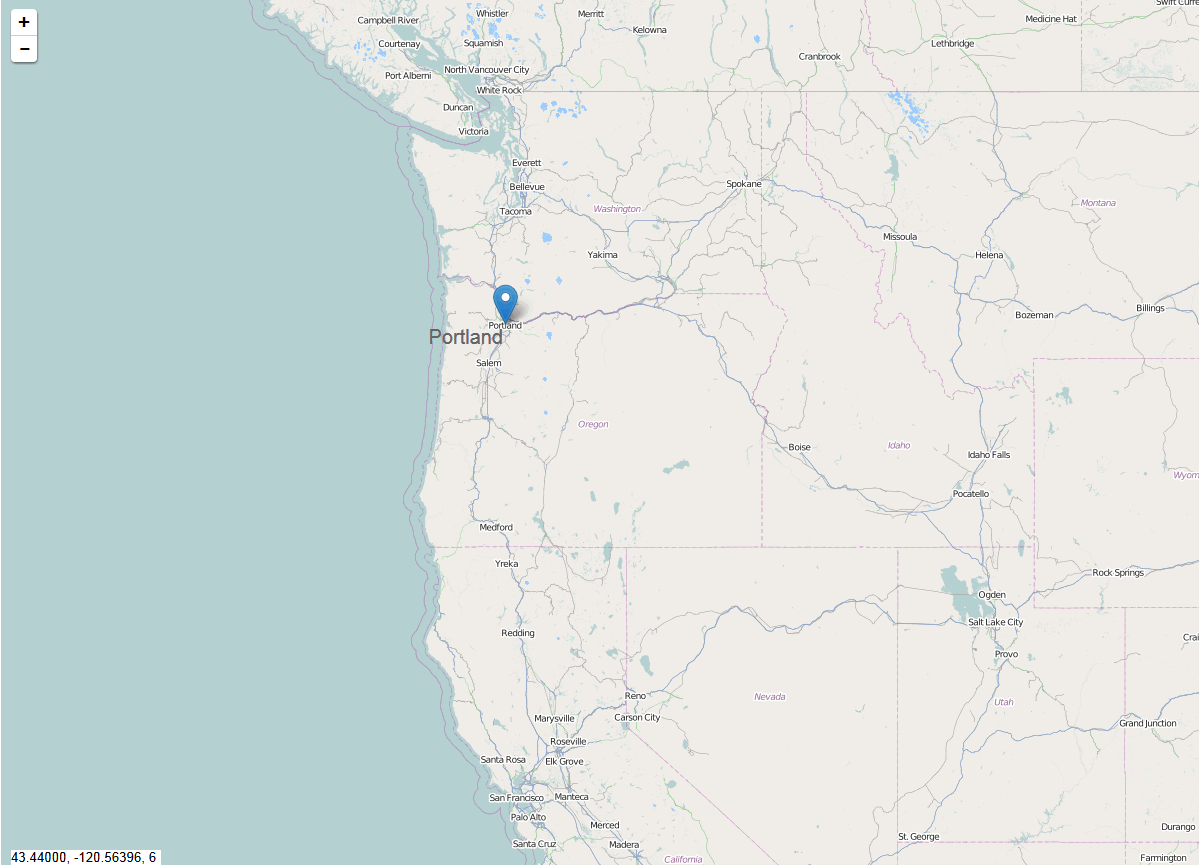
Map Tiles Provider only
In this example, a Map Tile provider is specified to display the map graphic. No GEO Feature File is specified. When using this approach the map can be interactive based on selecting plotted location points from the data source only (as shown using a pin in this example). The background Map Tile itself cannot be selected and its formatting cannot be modified. However, the map details are provided automatically and display the plotted location within an easily recognizable context.
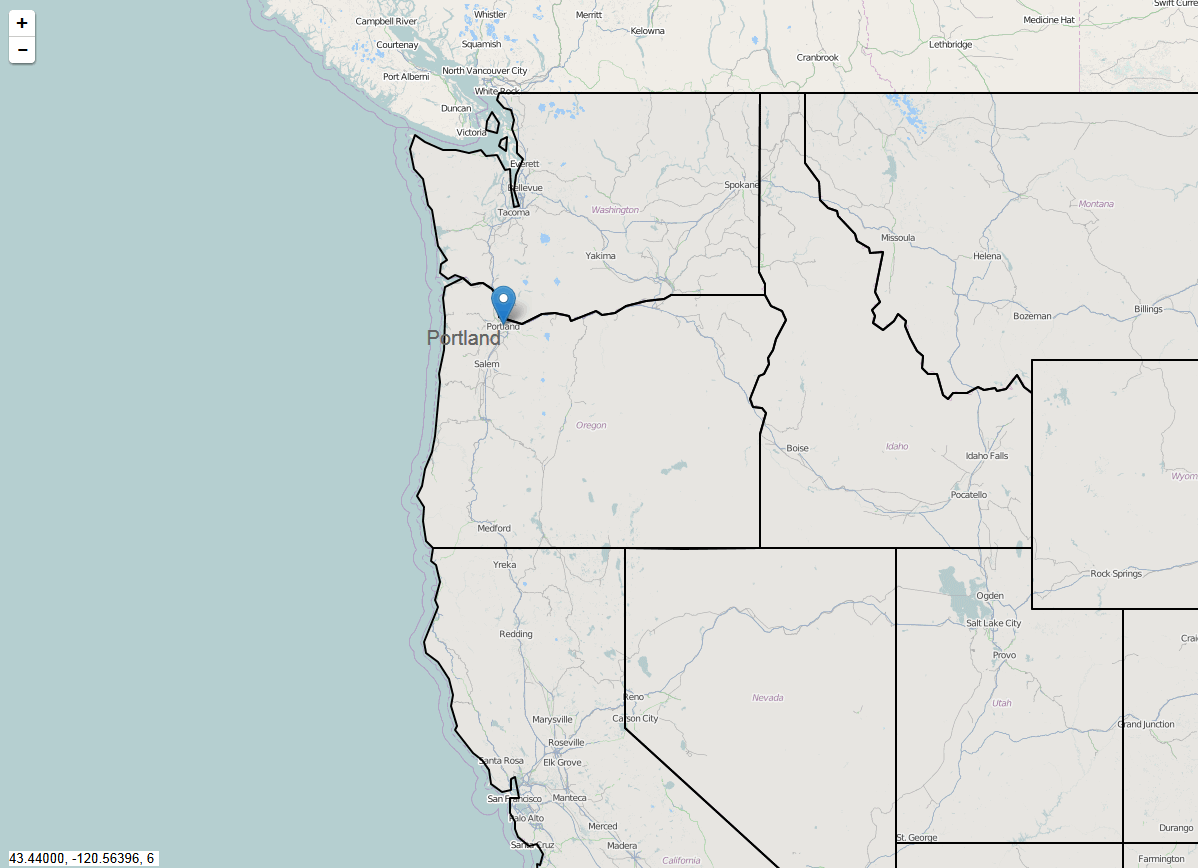
GEO Feature File and Map Tiles Provider
In this example, both a GEO Feature File and a Map Tiles Provider have been specified. The features in the GEO Feature File overlay the map tile and can still be used as interactive elements in the form.
Using a GEO Feature File
The GEO Feature File for Map View components uses the GeoJSON format to define the "features" (shapes) to display on the map. GeoJSON is an open standard format for encoding sets of geographic data structures. For more information on GeoJSON, visit http://geojson.org/ (external link).
You can obtain a GeoJSON file as follows:
- Axiom Software provides a set of standard files that you can use as is or customize to your needs. These standard files are located at
\Axiom\Axiom System\GEO Feature Files. These files can be used to provide the following shapes:- U.S. States
- World Countries
-
Various organizations and web sites may make GeoJSON files available for public use.
-
Your organization can create your own GeoJSON file using the specifications detailed on the official GeoJSON website linked above.
Once you have obtained the file, you must import it into the Reports Library, and then use the GEO Feature File URI setting in the Map View components to point to the file.
Enabling interactivity based on features in the GEO Feature File
If you want the features in the file to be interactive (selectable on the map), then you must complete the Feature ID Property in the Map View component settings. This setting tells Axiom Software which property in the GEO Format File should be used to identify the currently selected feature. When a user selects a feature in the map, the value for that property will be written to the Selected Value field for the Map View component.
For example, the standard us-states.json file has a property named code that uses the two-letter code for each state.
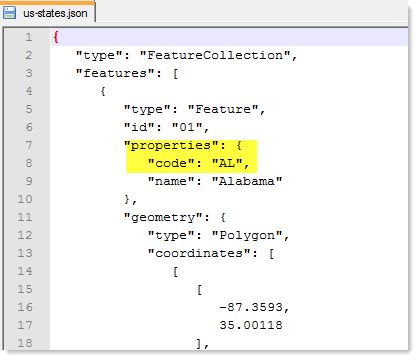
To use the code property to identify the state features in this file, you would indicate code as the Feature ID Property. When a user selects the Alabama feature in the map, the code AL will be written to the Selected Value field. The form can be configured to respond to the current selection—for example, to open another form with information relating to this state, or to filter the data displayed in another component such as a formatted grid or a column chart.
Although it is not required to define the feature items in the MapView data source in order to enable this interactivity, in many cases you will want to do this anyway in order to define display properties for each feature. When features are defined in the data source, the [RowID] for those features must use the property specified as the Feature ID Property. See the following section for more information.
Formatting features from the GEO Feature File in the data source
If desired, you can add the features from the GEO Feature File to the MapView data source, so that you can define display properties for the feature. You can define properties such as the fill color, line thickness and color, label text and position, and font properties. You can also specify a hyperlink to launch when the feature is selected, such as to open another form with information about the selected feature.
To do this, add a row for each feature that you want to style. The [RowID] for the feature must use the same property specified as the Feature ID Property in the Map View component settings. For example, if the property used is code for two-letter state codes, then enter the two-letter state codes as the RowID.
For more information on the available properties that can be set for features in the MapView data source, see Map View component for Axiom forms.
In most cases, GEO Feature Files are used to define shape features for the map. However, the GeoJSON specification also supports "point" features that relate to a single specific geographical location. If the GeoJSON file contains point features, these will be displayed using pins on the map. In the data source, point features must still be defined as Feature rows, not Pin rows—however they are subject to the same formatting limitations as Pin rows, such as not supporting a fill color.
Using a Map Tiles Provider
To use a Map Tiles Provider, select the desired provider from the Map Tiles Provider setting in the Map View component properties. Currently, the only available provider is Open Street Map (external link).
When using a Map Tiles Provider, you do not have to specify what area of the map to display. This will be determined based on the starting Lat, Lon, Zoom specified for the Map View component (latitude, longitude, and zoom level), and the size of the Map View component on the canvas (a larger component means that more area of the map will display).
If Allow Map Navigation is enabled for the component, then users will be able to move the map around within the component space to view different areas of the map. This means that users can move to any area on the map, including areas where no locations are plotted and no features are displayed (if using a GEO Feature File as well).
OpenStreetMap data is copyright © OpenStreetMap contributors, available under the Open Database License. http://www.openstreetmap.org/copyright (external link)
