Drill on measure details
All measures in use by a Perspective, Objective, or Initiative come with a detail page that displays when you click the measure’s graph icon ( ).
).
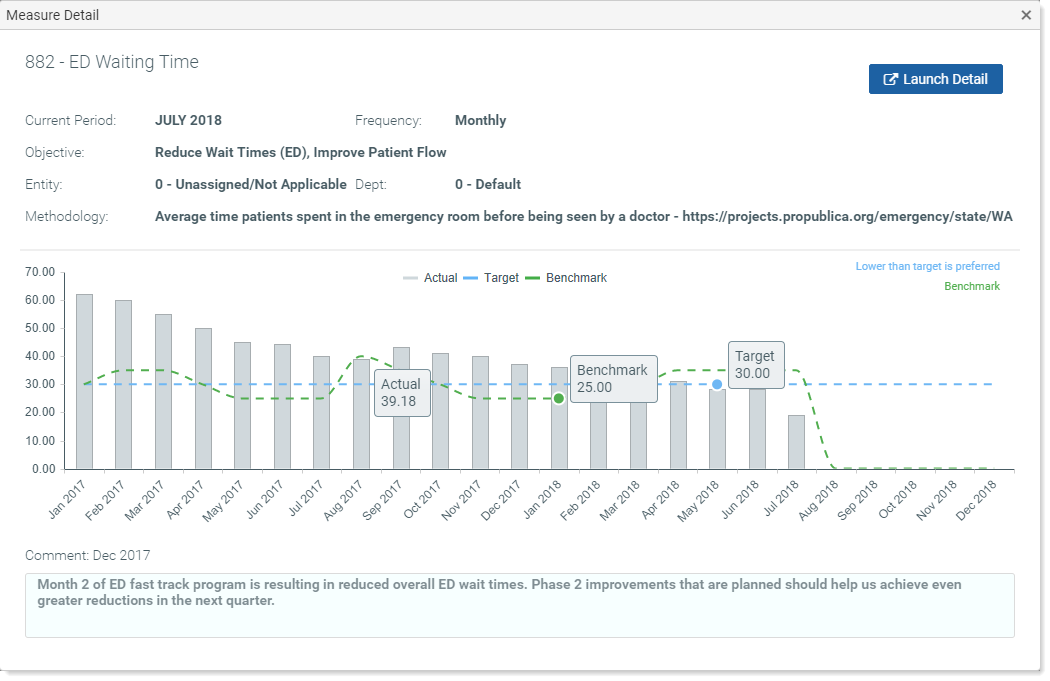
The Measure Detail window displays a bar graph of the measure data captured over time, beginning with the first month in the measure’s set active period and ending with the last month of the active period, as shown in the following example.
To use the Measure Detail window:
- To view the actual data figure for a month, hover your cursor over that month’s bar. The measurement for that month, titled “Actual,” displays in a label superimposed on the bar, as shown in the preceding example. Measure Detail graphs can display three kinds of measure unit types:
- Non-currency numbers – For numbers such as time, no symbol displays. In the previous example, the measurement for September 2017 is 39.18 minutes. The Benchmark number is 25 minutes, and the target is 30 minutes.
- Currency – If the measurement unit type is dollars, a dollar sign displays to the left of the number. Currency amounts are rounded to two decimal places: A $4.6789 rate per unit (Unit = Amount) would display as $4.68. A $0.6789 rate per unit would display as $0.68.
- Percentage – If the measurement unit type is a percentage, a percentage sign displays to the right of the number. Percentages are rounded to one decimal place to the right of the period: half of one percent displays as 0.5%. Fifty percent displays as 50.0%.
-
To view a comment associated with the data for a given month, click the bar for that month. Any associated comment displays in the Comment field at the bottom of the window. The Comment field title shows the month the comment applies to. In the example, it is December 2017.
- To view the measure target, hover your cursor over the dotted blue line; a target label displays.
- To view the benchmarkA measurement used as a point of comparison for assessing how a company's business practices and performance standards compare with those of other, similar companies. number, hover your cursor over the dotted green line; a benchmark label displays. Not all measures have benchmarks.
- If the measure detail has an associated drill documentA report or form that provides additional data or other information about a measure, that you access by clicking the measure or other associated trigger such as a button or icon., there is a Launch Detail button in the upper right corner. To drill further on the data, click the Launch Detail button. Any associated report or other drill document opens to show additional detail. If the document is an Axiom web-enabled form, it opens in the browser. If the document is another type of file, such as a PDF or Excel spreadsheet, the system opens it from the Desktop Client in a separate window.
