AX1696
Web reports may contain one or more data grids to return data into the report. While viewing a data grid, you can make various adjustments to the display and also further explore the data.
This topic details the various features that you can use when viewing a data grid in a finished web report. For more information on creating a new web report and configuring a data grid, see Creating web reports and Data Grid component for web reports.
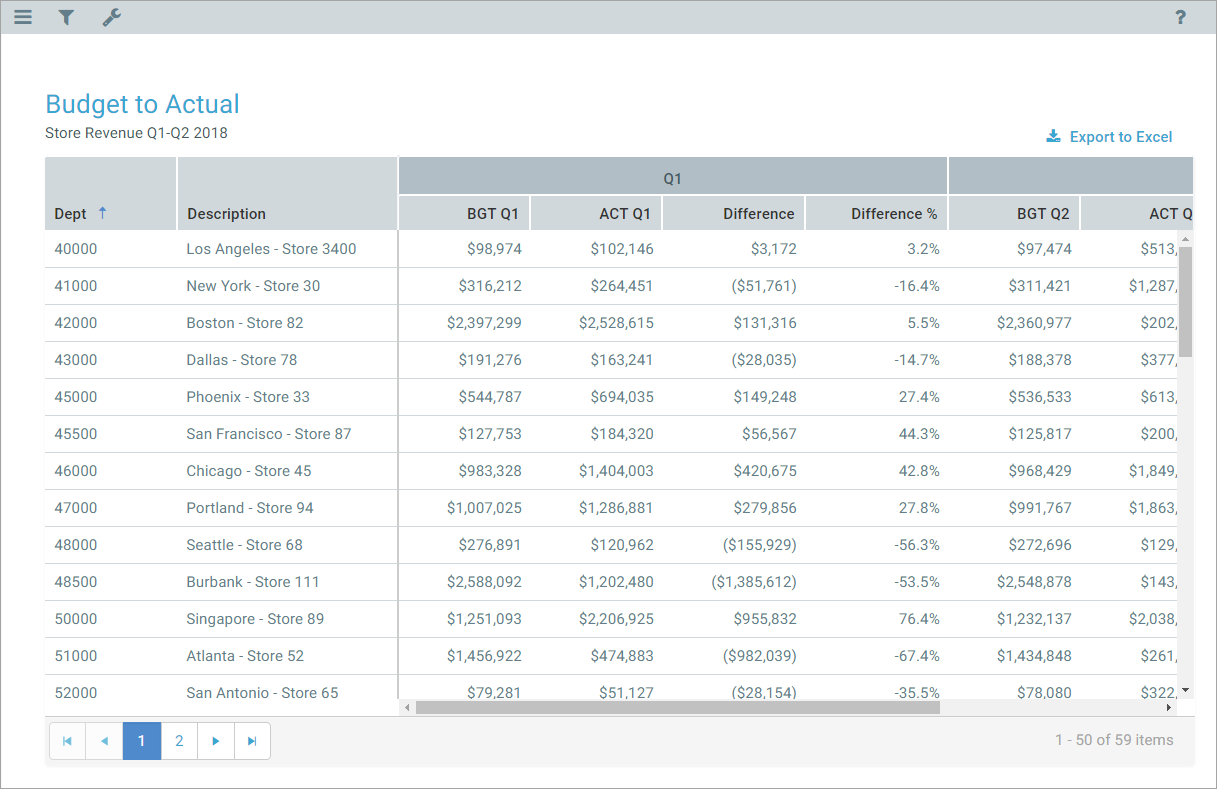
Example data grid
NOTE: If you refresh the data shown in the data grid—such as by using the Filters panel—then all user changes to the grid are reset along with the new data.
Grid basics
Data grids show a specified number of records per page. This page limit is configured per data grid, by the report creator. If the data in your grid exceeds the page limit, you can move between pages using the page controls at the bottom left of the grid.
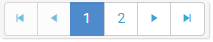
Page controls for data grids
- Click a page number to move directly to that page.
- Click the single arrow buttons to move one page back or forward.
- Click the double arrow buttons to move to the first page or the last page.
You can make minor adjustments to the column display as follows:
-
To change the column width, hover your cursor along the right edge of the column header, then drag to make the column thinner or wider.
-
To reorder columns, click on a column header and then drag it to a new location within the header. Note that columns cannot be moved in or out of a column group (meaning a set of columns grouped under header text). If a column belongs to a column group, you can change its order within the group but you cannot drag it out of the group.
Sorting and filtering data
To sort the grid by any column, click on the column header. Each click toggles between ascending sort, descending sort, and no sort. If the grid is currently sorted by a column, the sort direction is indicated by an arrow on the column header (up for ascending, down for descending).
Some columns may allow filtering the grid by the column data. For example, you might want to filter a data column to hide zero-value records, or to show all records above or below a certain value. You might want to filter a dimension column to hide or show certain dimensions (such as departments, accounts, and so on). The report creator determines whether a column is enabled for filtering.
If a column allows filtering, the filter icon displays in the column header when you hover your cursor over the column header. The filter icon displays on the right side if the header text is left-aligned or center-aligned, and on the left side if the header text is right-aligned.
![]()
Filter icon for a column with filtering enabled
To filter the grid based on a column:
- Click the filter icon in the column header to show the filter options.
-
Set the filter options as desired. You can set up to two filter options, combined with either AND or OR.
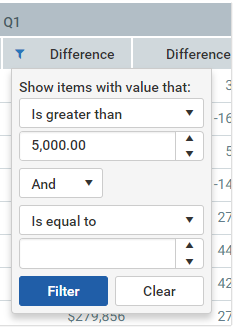
Example filtering options
- Click Apply.
The grid updates to only show records that meet the filter. Additionally, the filter icon in the column header is now visible and blue to indicate that the grid is filtered by this column.
The filter is retained until you clear it, or until the data grid is refreshed with new data.
To clear a filter:
- Click the filter icon in the column header to show the filter options.
- Click Clear.
The grid updates to clear the filter. The filter icon is now only visible when hovering over the column header.
Viewing grouped data
Data grids may be configured to show data in hierarchical groups. For example, you may initially see the top level data by WorldRegion, then expand a world region to see the Region data within it, then expand a region to see the individual departments in that region. The report creator determines whether a grid is grouped or not, as well as the grouping levels.
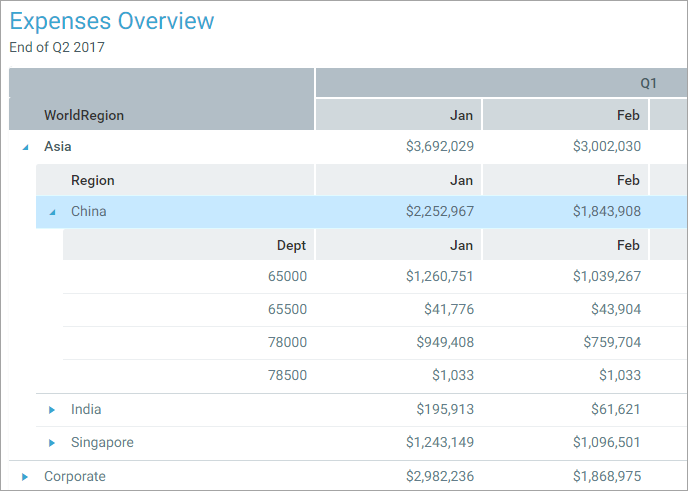
Example expanded groupings
If a grid is grouped, you can expand or collapse a grouping by clicking on the triangle icon in the left-hand side of the grid.
When viewing grouped data, the page controls apply to each grouping instead of to the overall grid. For example, if you expand a group and the next level of rows in that group exceed 50 rows (or whatever the configured row limit is), then the rows inside that group are paged.
Drilling data
If the data grid has been configured to enable drilling, you can drill any row in the grid as follows:
- Hover your cursor over the far left column in the grid so that a magnifying glass icon appears.
- Click the icon to drill the row.
![]()
Hover and click to drill
You may be presented with a flat list of drilling levels, or you may be prompted to first select a drilling category and then choose a level within that category. The report creator determines whether a grid is enabled for drilling, and the drilling choices.
Once you select a drilling level, the drill results are displayed in a new tab. You can further drill the results if desired. If you drill the results, the new results are displayed in the same tab.
Export grid data to an Excel spreadsheet
If the data grid has been configured to allow exporting data, an Export to Excel button displays at the top right of the grid. You can click this button to export the grid data to a Microsoft Excel spreadsheet (XLSX file). The report creator determines whether exporting to spreadsheet is enabled.
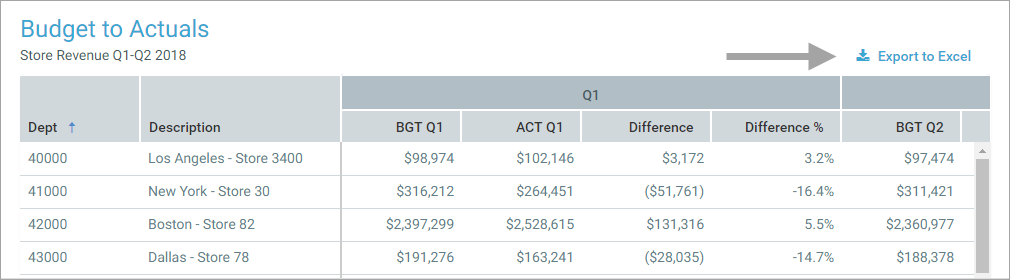
Data grid configured to allow export to spreadsheet
When you export data, all of the data in the grid is copied into an XLSX file. This file is then handled by your browser to determine how you can open and/or save the file locally.
Any user formatting applied to the grid is not retained in the export file. This includes sorting, filtering, and moving columns. The grid data is exported in its original state. However, if you have used the Filters panel to filter the file, that filter is applied to the exported data.
