AX2125
Certain components—such as formatted grids, combo boxes, and various charts—require data sources to define the data to be displayed in that component.
Data sources are defined in the source spreadsheet file and then linked to their associated component on the Axiom form canvas. This is accomplished by:
- Using reserved tags in the file to flag data as belonging to a particular data source.
- Configuring the component properties to use that data source.
This topic discusses the general process of how to tag data in a sheet and configure a component to use that data. You can use any means to bring the data into the sheet—such as Axiom queries, data lookups, GetData functions, or hard-coding data. For more information on designing the file to bring in data for an Axiom form, see Setting up the source file for the Axiom form.
Placing data source tags in a sheet
To define a data source for use in an Axiom form component, you must flag the data in the spreadsheet using reserved tags. The specific tags to use depend on the type of component. The following example shows the data source tags for a column chart. In this example, the data is hard-coded—the purpose of the example is simply to show the structure of the tags.
The general structure is as follows:
- A primary data source tag to define the data source, and to identify the control row and control column for the data source (B2 in this example).
- Row and column tags to identify the labels and the data to include in the data source, as well as other data source properties (column B and row 2 in this example).
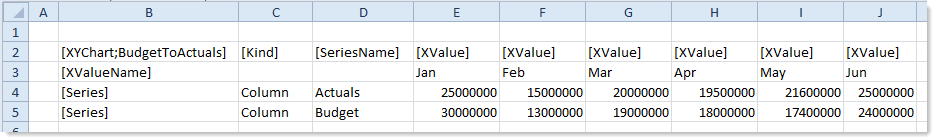
Example data source tags
IMPORTANT: All column and row tags must be placed underneath and to the right of the primary tag. Axiom Software will not recognize any row tags placed above the primary tag, or any column tags placed to the left of the primary tag. The column and row tags do not need to be contiguous; there can be blank columns and rows in between the tags. Axiom Software will stop reading column and row tags if it encounters a new primary tag or a tag that is not valid for the current primary tag (thus allowing data sources to be placed side by side or stacked on top of each other). The primary tag must be placed within the first 500 rows of the sheet.
You can manually type these tags, or you can use a wizard to automatically create tags for you. You can add the tags first and then populate the cells with data, or if the data already exists in the sheet then you can highlight the data to add the tags around it. To use the wizard:
- Right-click and select Create Axiom Form Data Source, and then select the type of data source. For example: Create Axiom Form Data Source > Column Chart.
If you right-clicked on highlighted data, then the tags will be placed to the left and top of the selected data (these cells must be blank; the wizard will not overwrite any existing contents). The data source name in the primary tag will be generic, such as "ColumnChartSource1"—you can leave this or change it to something that better describes the data in the data source, such as "BudgetToActuals" in the example above.
If the data for the data source is populated using an Axiom query, and the query is set to rebuild or insert, then you should generate some of the tags using the in-sheet calc method, so that they will adjust dynamically to the data. For example, if the query is a standard vertical query, then the row tags should be generated using the in-sheet calc method. This means that as the query inserts rows into the data range, they will be tagged to be included in the data source.
For more information on the specific tag syntax for each component type, see the individual topic for each component. A list of all components with links to their individual topics can be found here: Axiom form components.
Specifying the data source for a component
Once the data source tags have been placed in the sheet, you can configure the component to use that data source. In the Form Assistant task pane, select the component in the canvas so that its properties display at the bottom of the pane. Then, set the Data Source property to the data source that you created.
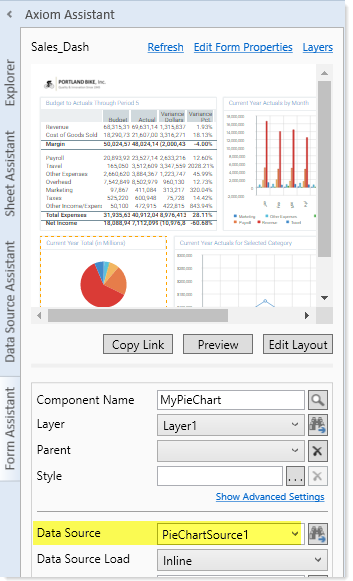
Data sources display in the drop-down list using the name defined in the primary tag. Only data sources that are appropriate for the component type are listed (for example, only Pie Chart data sources display when configuring a Pie Chart).
NOTES:
- Bar Charts, Column Charts, Area Charts, Waterfall Charts, and Line Charts all use the same data source type—XYChart. All eligible XYChart data sources will display when configuring these charts, regardless of which component type you placed on the canvas.
- Scatter Charts, Scatter Line Charts, and Bubble Charts all use the same data source type—ScatterChart. All eligible ScatterChart data sources will display when configuring these charts, regardless of which component type you placed on the canvas.
You can also edit the component properties using the Form Designer.
If you are working with a component's properties and you want to find its corresponding data source in the file, click the Show location ![]() button to the right of the drop-down list. This will move your cursor to the associated data source tag in the file.
button to the right of the drop-down list. This will move your cursor to the associated data source tag in the file.
