AX1580
Configuring default display options for a sheet
You can configure various display options for sheets in Axiom files on the Control Sheet. These settings are applied when a user opens the Axiom file and the sheet is made active.
It is often useful to set these values in the Control Sheet instead of using Excel features, so that the desired initial state of the file is not inadvertently changed when saving the file. For example, you might want the zoom level of a particular sheet to always start at 85%. You can set this zoom level in Excel and save the file, but this setting may be inadvertently lost if another user later changes the zoom level to 120% and saves the file. Instead, you can set the zoom level to 85% on the Control Sheet, and this setting will always be applied, regardless of the zoom level when the file was last saved.
Headings
You can specify whether the spreadsheet row and column headings are initially visible when a user opens an Axiom file. Row and column headings are often hidden to reduce visual clutter when displaying sheets to end users.
NOTE: This option is set at the workbook level and applies to all sheets in the file.
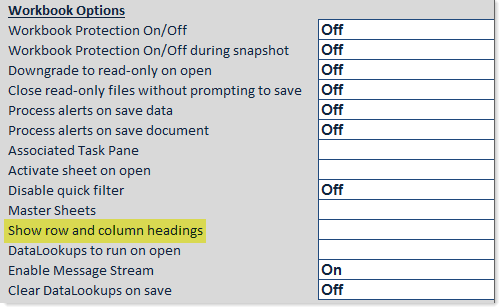
To set the visibility of row and column headings, use the Show row and column headings property in the Workbook Options section of the Control Sheet. This property can be set as follows:
- <Blank>: Row and column headings are visible if the file is opened read/write, and hidden if the file is opened read-only. This is the default setting.
- On: Row and column headings are visible when the file is opened.
- Off: Row and column headings are hidden when the file is opened.
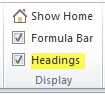
This only determines the initial state of the row and column headings. Once the file is opened, users can choose to toggle the headings shown or hidden for the current session by using the Headings check box in the Display group of the Axiom ribbon tab (or by using Excel functionality).
Additionally, clicking Show Everything on the Axiom Designer tab will show the headings.
Freeze panes
You can define the freeze panes area for each sheet in an Axiom file. The freeze panes feature is useful to "hide" setup areas at the top and left of the sheet, and to lock header rows and columns in place for scrolling purposes.
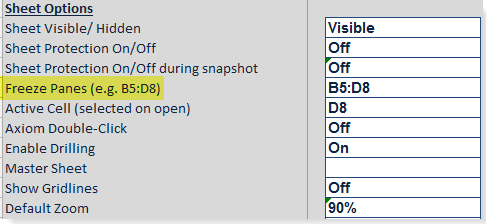
To define the freeze panes area of a sheet, use the Freeze Panes property in the Sheet Options section of the Control Sheet. Enter the top left and bottom right cells of the area you want frozen—for example: B5:D8. B5 indicates the start of the frozen area, and D8 indicates the first unfrozen cell. Columns B and C will be frozen, and rows 5:7 will be frozen.
The freeze panes setting is applied when the file is opened. Users can only unfreeze panes if the sheet is not protected, or if they have security rights to unprotect the sheet. You can toggle the freeze panes on and off from File Options > Freeze Panes.
Freeze panes settings are reapplied when a view is applied. This means that if a view has been applied to the sheet (either manually by a user, or automatically via the Initial Dynamic View setting), then freeze panes will be reapplied each time the sheet is refreshed, since the view is automatically reapplied after refresh. If desired, you can use a formula to determine what the freeze panes settings should be, based on the current view.
NOTE: If a file has been saved with applied freeze panes, then clearing the Freeze Panes setting will not remove the frozen panes. If you want to remove the frozen panes entirely, you must clear the setting on the Control Sheet, and then manually toggle the frozen panes off, and then save the file.
Example
In the following report, the freeze panes setting is C11:D14:
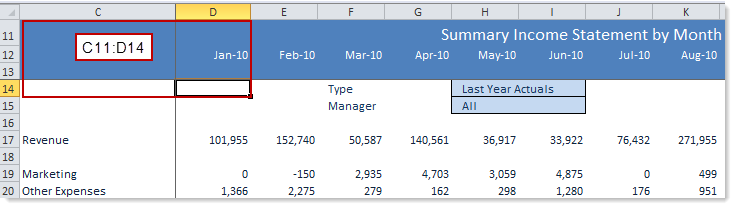
The frozen panes start at the first cell in the range (C11) and then continue to the top and left of the last cell in the range (D14). When you scroll across, column C is always frozen onscreen. When you scroll down, rows 11-13 are always frozen onscreen.
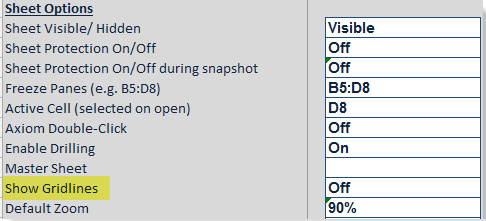
Gridlines
You can specify whether gridlines should be visible by default for each sheet in an Axiom file. Gridlines are often hidden to reduce visual clutter when displaying sheets to end users.
To set the visibility of gridlines, use the Show Gridlines property in the Sheet Options section of the Control Sheet. This property can be set as follows:
- <Blank>: Gridlines are left as is when the file is opened. The visibility of gridlines is controlled by Excel functionality.
- On: Gridlines are visible when the file is opened.
- Off: Gridlines are hidden when the file is opened.
Once the file is opened, the user can toggle the gridlines visible or hidden using Excel functionality, for the current session. The next time the file is opened, the Control Sheet setting is applied again.
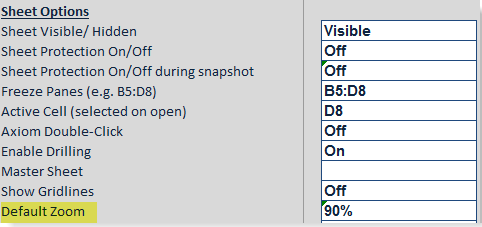
Zoom
You can specify the default zoom level for each sheet in an Axiom file. To set the zoom level, use the Default Zoom property in the Sheet Options section of the Control Sheet. Enter a percentage as an integer, with or without a percentage sign—for example, either 90 or 90% is valid.
When the file is opened, the default zoom level is applied to the sheet. The user can change the zoom level using Excel functionality, for the current session. The next time the file is opened, the Control Sheet setting is applied again.
If Default Zoom is blank, then the zoom level in the sheet is left as is. The zoom level is controlled by Excel functionality.
