AX2069
Grouping is a Microsoft Excel feature that allows you to group multiple rows together. Once rows are grouped, you can expand and collapse the grouped sections by using the plus and minus icons displayed along the side of the spreadsheet. This feature is also known as "outlining."
Using grouping, you can present a lot of information in a small amount of space. Typically the "anchor" rows of each group present some kind of subtotals or header information, and then you can expand the group to see the detailed data.
You can enable grouping for an Axiom query, and then the results of each data range will be automatically grouped. This feature is best suited for queries that use multiple data ranges (with a different filter defined for each data range), or reports that use multiple nested Axiom queries.
NOTES:
- Grouping is only supported for use with standard vertical queries. This setting is ignored for horizontal queries.
- Only six Axiom queries can be enabled for grouping per sheet.
To enable grouping for an Axiom query:
- In the Sheet Assistant, in the Refresh Settings section for the query, select Apply Groupings.
This setting is located on the Control Sheet in the Display/User Interaction Options section for the query, as Apply grouping to data ranges.
When you refresh the query, each data range in that query is automatically grouped. The anchor row for the grouping is the row that contains the [AQ#] tag. All rows in the data range are grouped, including the row containing the [Stop] tag.
In the spreadsheet, a plus sign displays to the left of the anchor row. You can click on the plus sign to expand the section and see all the detail rows. If a section is expanded, you can click on the minus sign to collapse it. You can also use the "outline level" icons at the top of the grouping sidebar.
Note the following query behavior if grouping is enabled:
- Grouping is applied if the refresh option for the query is set to rebuild or insert. Any expanded sections are collapsed when the query is refreshed.
- If the query only updates existing data, grouping is not applied. However, any previously existing groupings will not be removed.
NOTE: If the sheet also uses a sheet view, note that applying a sheet view causes groupings to become expanded. You can work around this by tagging the rows within the grouping to be hidden by the view. You should hide all rows in the grouping except the row with the plus sign.
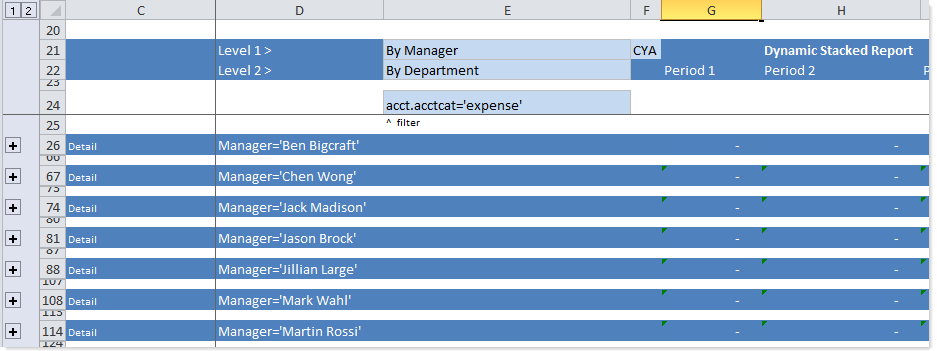
Grouping example
This example shows grouping being applied to multiple data ranges. Each data range in this query has a filter that limits the data to a particular manager.
The grouping controls display in a sidebar to the left of the spreadsheet:
To expand a section, click on the plus icon in the sidebar:
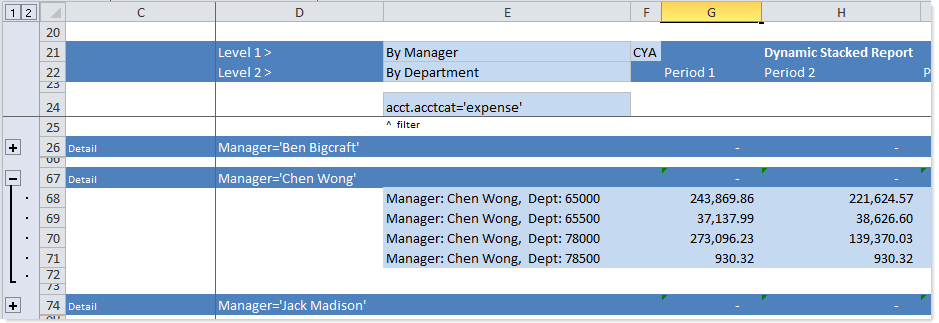
You can also use the "outline level" icons at the top of the sidebar. For example, clicking outline level 2 would expand all of the sections. To collapse all of the sections, click outline level 1.
AX2069
