Setting up drilling for Data Grid components in web reports
You can enable drilling for Data Grid components in web reports, and configure the grid so that certain drilling selections are available to users. If drilling is enabled, users can drill any row in the grid by clicking on a drill icon that displays on each row. Users can select a drilling level from among the available selections, and then the drilling results are presented in a separate web page. Users can continue to drill the drilling results if desired, or return to the original grid and drill again from there.
When configuring drilling for the grid, you specify one or more hierarchies from a lookup table (based on the primary table of the data source). Users can then drill to any level of the hierarchy.
NOTE: Some browsers may require pop-ups to be allowed for the Axiom Software site in order to perform drilling in a web report.
Enabling drilling for a Data Grid component
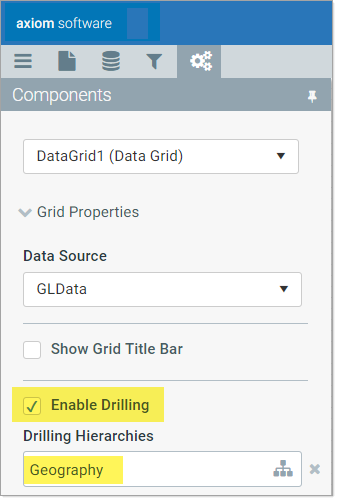
Drilling is configured on the Components panel ![]()
| Item | Description |
|---|---|
|
Enable Drilling |
Select this check box to enable drilling for the data grid. If enabled, users can "drill down" a row in the grid to see the data in that row at a different level of detail. |
|
Drilling Hierarchies |
Specify one or more hierarchies in a lookup table to determine the drilling levels available to users. To select hierarchies, click the hierarchies icon NOTE: If you leave the Drilling Hierarchies box blank, then the user can drill on any valid hierarchy. Essentially, this is as if you selected all tables in the Select Table dialog, showing all hierarchies on those tables. |
When selecting hierarchies for drilling, you are first prompted to choose a table. The dialog is limited to showing only reference tables with hierarchies, where the primary table of the data source has a lookup relationship to the tables. Once you have selected a table, you can click OK to use all hierarchies on that table, or you can click Next to select specific hierarchies.
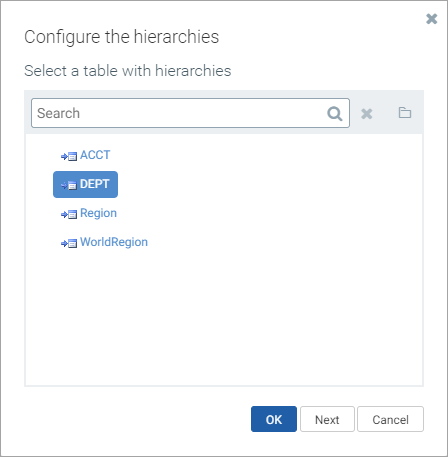
Example table selection for drilling hierarchies
If you click Next, the next screen prompts you to choose one or more hierarchies on that table. Select the hierarchies that you want to use, and then click OK.
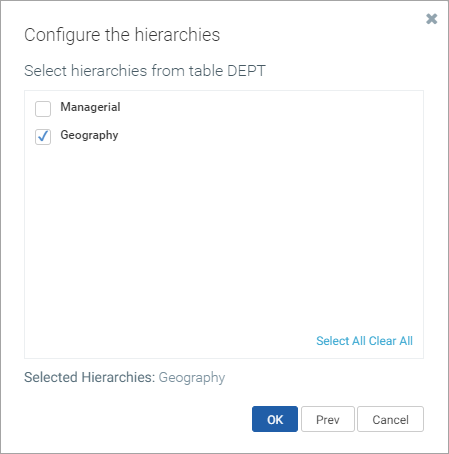
Example hierarchy selection for drilling hierarchies
For information on creating hierarchies, see Dimensions and hierarchies.
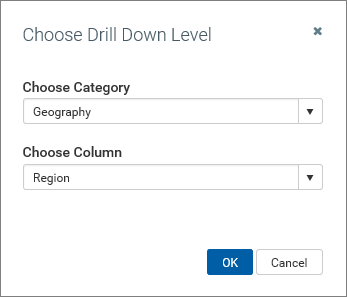
If multiple hierarchies are available for drilling, users first select a category (the hierarchy) and then select a column in the hierarchy. In the following example, the user has selected the Geography hierarchy and then the Region column, so the drilling data will use regions as the rows.
NOTE: If the query data contains multiple paths to the hierarchy columns, the same hierarchy will show multiple times (once for each valid path). The user must select the path that they want to use for the drill.
If only one hierarchy is available (and the data has only one path to that hierarchy), then the user does not have to select the hierarchy. Instead, the columns in the hierarchy are presented directly in the dialog. In the following example, the Geography hierarchy is the only available hierarchy, so the user can directly select any column in that hierarchy.
The following example is intended to give web report creators an idea of the user experience when drilling a Data Grid component.
In this example, the Data Grid component is configured as follows:
- The primary table of the assigned data source is GL2018.
- Enable Drilling has been enabled for the component.
- The Drilling Hierarchies property is set to the Geography hierarchy on the Dept table.
When the web report is viewed, the first column in the data grid is now the drill action column. When a user hovers their cursor in that column, they can see a drill icon (a magnifying glass) for the current row. The user can click on the icon to initiate a drill for that row.
![]()
Drill action column displays drill icon on hover
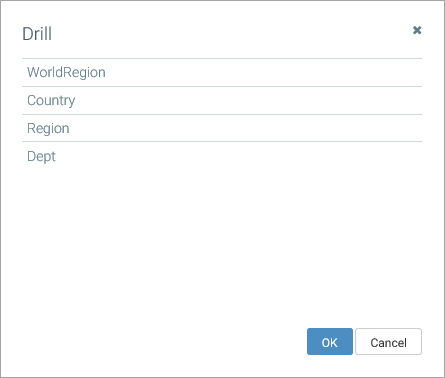
Once the user has initiated the drill, a dialog opens to display the available drilling levels. In this example, these drill levels are the columns in the Geography hierarchy. (If instead multiple hierarchies were available for drilling, the dialog would first prompt users to select the hierarchy and then select the desired column in that hierarchy.)
User is prompted to select drill level
After the user selects a drill level, a new browser tab opens to display the drill results. In this example, the data for the VP Frank Martinez row is now shown at the region level.
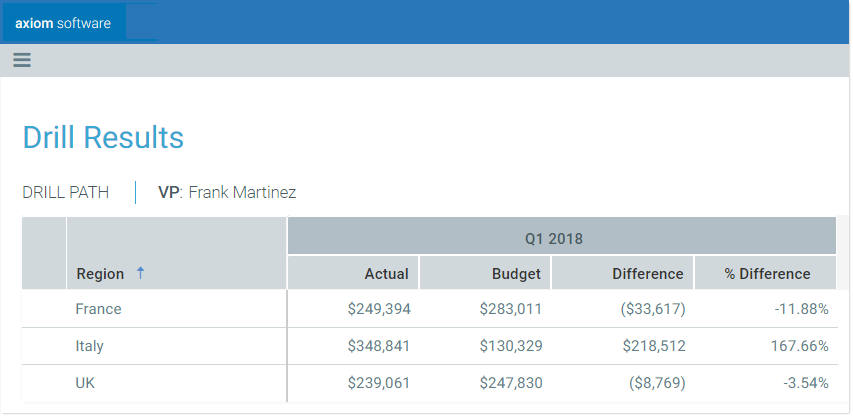
Drill results display in a new tab
The drill results automatically include all columns from the original data grid except for the sum by columns, which are replaced by the selected drill level. The current drilling path is displayed at the top of the page.
If desired, the user can further drill on the drill results, using the same drilling options. For example, the user could now choose to drill down to view the departments in a region. In this case, the drill results are presented in the same browser tab, replacing the current drill results.
