AX1122
Subtotaling data by a dimension in the Data Explorer
You can place more than one dimension field in the Rows box, to display the data using multiple dimensions. By default, each row in the Data Explorer will be grouped by all dimension fields (similar to using two or more fields in the "sum by" of an Axiom query). For example, if you define Dept and Acct as your row dimensions, then you will have one row for each unique account/department combination.
If desired, you can define subtotal groupings using one or more of your defined row dimensions, by dragging and dropping a column header to the top of the data grid. This additional grouping area is only available when the Rows box contains at least two dimension fields.
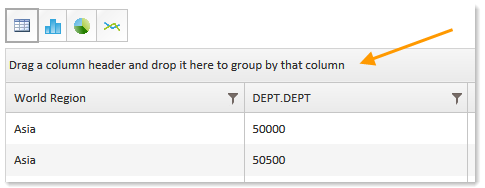
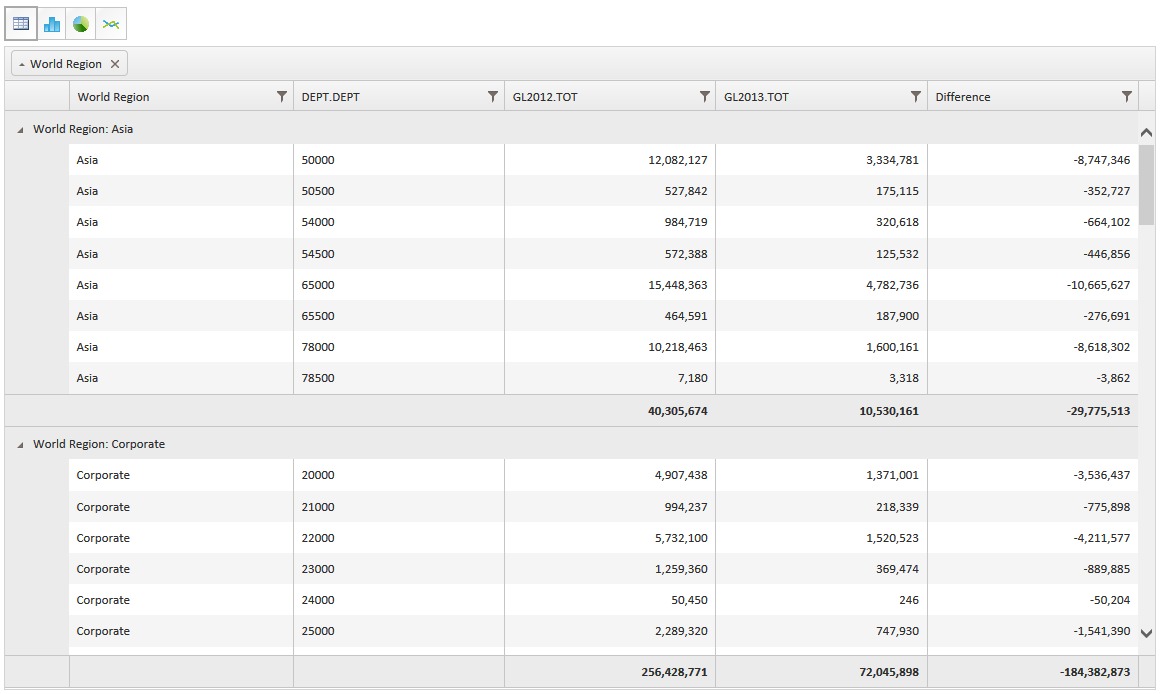
For example, imagine that you want to display department data, grouped and subtotaled by World Region. You would place both World Region and Dept into the Rows box, and then you would drag and drop the World Region column header to the top of the grid. The data now displays as shown in the following screenshot, using collapsible groupings:
You can change the sort order of the grouping blocks by clicking the dimension field in the grouping header. To remove the grouping blocks, click the X to the right of the dimension name.
Data that is grouped and subtotaled in this way cannot be exported to a spreadsheet.
