AX1560
Drilling rows in a grid
Axiom forms may contain grids of data, and these grids can be configured to enable data drilling. When you drill a row in a grid, you can see the data in that row shown at a different level of detail.
For example, the grid may be showing an Income Statement for the consolidated organization. You can drill rows in this report, such as a revenue row, to see the data broken out by region, entity, VP, or some other grouping.
How to tell if you can drill a row
If a grid is enabled for drilling, then you can tell which rows are available for drilling as follows:
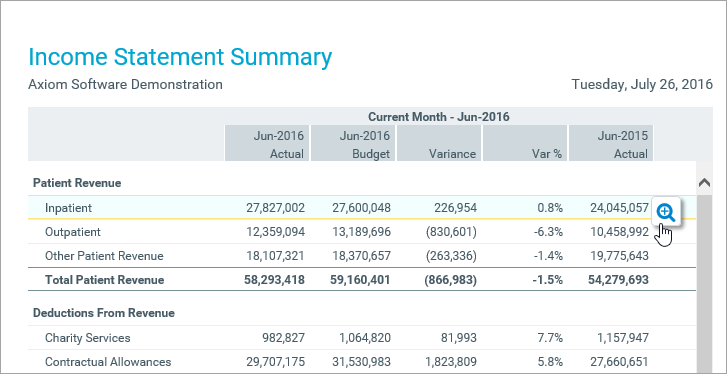
- The row becomes highlighted when you hover over it.
- A drill icon (a magnifying glass) displays on the far right of the row when you hover over it.
Both the highlighting and the icon must be present in order to drill. Rows can become highlighted for reasons other than drilling, such as when rows are selectable within a grid.
The following screenshot shows what a drillable row looks like when you hover over it:
Drilling a row
To drill a row, hover over the row and then click the drill icon (the magnifying glass) on the far right end of the row. If you do not see this icon, then the row is not drillable.
After initiating the drill, you must then select the level that you want to drill down to. For example, do you want to see the row's data broken out by regions, VPs, or departments? The available drill levels for the grid are determined by the form designer, so you may see different drilling options when you drill on different grids.
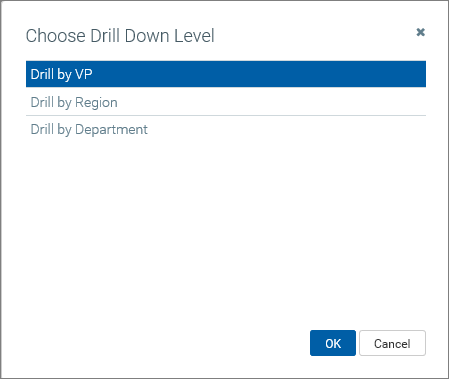
If only one set of drilling options are available, those options will be presented directly in the Choose Drill Down Level dialog. For example:
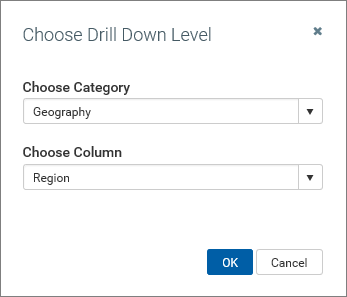
If multiple "sets" of drilling levels are available, then you must first select a drilling category, then select a level in that category. For example:
Once you select a drilling level, the drill results open in a separate tab, in a simple grid. Note the following:
-
The dimensionality of the row that you drilled is shown in a subtitle above the grid, as the Drill Path. For example, if you drilled a row of revenue data, the Drill Path will be shown as something like AcctCategory: Revenue. The exact terminology depends on your system's column names and terms.
-
The drill results are grouped by your selected drill level. For example, if you selected regions, then the rows in the grid are by region.
-
The drill results may show all of the data columns from the original grid, or only subset of these columns. The columns shown in the drill results are determined by the form designer.\
NOTE: In some browsers, you may have to allow pop-ups for the Axiom Software site in order to open the drill results tab. If the drill results tab does not open, your browser will inform you that it is blocking pop-ups.
You can sort on any column shown in the drill results by clicking on the column header. To filter or group the drill results, click on the enable grouping and filtering link in the top right corner of the page. Once enabled, you can:
-
Click the filter icon to the right of any column header to filter based on values in that column. Various filtering options are available (depending on column type), such as Is equal to or Does not equal, Starts with or Ends with, and Is greater than or Is less than. Set the desired filter and then click Filter to filter the results. To clear the filter, click the filter icon again and then click Clear.
-
Drag any column header to the top section to show the results grouped by the values in that column. To clear any grouping, click the X to the right of the column name.
To hide the grouping and filtering options and clear any applied grouping or filter, click hide grouping and filtering in the top right corner of the page.
Custom drilling
In addition to the standard drilling feature described in this topic, Axiom forms can be set up to provide a variety of custom drilling needs. When using custom drilling, the way the drilling works is entirely up to the form designer. Please contact your system administrator if you have any questions about a custom drilling feature within a form.
For example, you might see a "more information" link on each row of a grid. Clicking this link may open a second form that contains more information about the item on the row. The content of this second form could contain a detailed report, or dashboard-style charts and graphs.
