AX1462
Viewing data diagrams
Data diagrams can be shared with users to document and communicate table relationships in Axiom Software. If you have access to a diagram, you can open the diagram and explore the relationships presented in the diagram.
For example, report writers may be given a diagram of the tables they are reporting on, so that they understand how the tables are joined and which lookup tables can be used to filter or sum the query.
In order to view a data diagram, you must have at least read-only access to the diagram, as defined in security.
Diagrams can be opened from either the Web Client or the Desktop ClientGeneral term for using either the Excel Client or the Windows Client, both of which are installed to the user's desktop.. Regardless of where the file is opened, the diagram always opens in the Web Client for viewing.
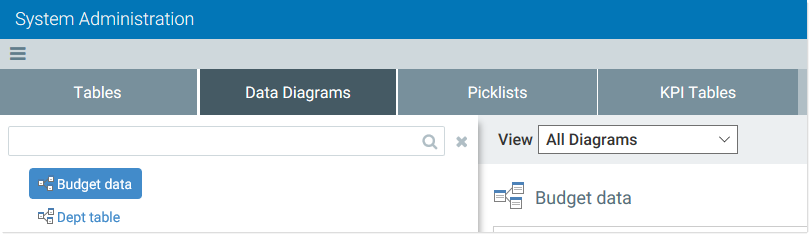
Opening a data diagram using the Web Client
You can open a data diagram from the Table Manager in the Web Client.
-
-
In the left-hand pane, select the diagram that you want to view.
You can change the View options or use the Search box to help find the diagram that you are looking for.
The diagram opens as read-only in the diagram viewer. You can explore the diagram in this view.
Data diagrams can also be opened from the Desktop Client. For more information, see Opening a data diagram using the Desktop Client.
Exploring a data diagram
Data diagrams consist of tables and the connections between those tables (via lookup column relationships). Tables with lookup relationships are connected with a line. An arrowhead points at the lookup table to indicate the direction of the relationship (TableX looks up to TableY).
![]()
If two tables on the diagram have a lookup relationship, that relationship is always marked with a line. However, the tables in the diagram may have relationships with other tables that are not on the diagram. The diagram designer has chosen which tables to show.
Each table displays in a box with the table name in the top left corner, and an icon representing the table classification in the top right corner. The table classification is also represented by color: blue for data tables, green for reference tables, and orange for document reference tables. When viewing a diagram you can see all tables that were saved in the diagram, including tables that you do not have security permission to access.
Each table displays a list of its key columns and any other columns with lookup relationships. If the table box is too small to see all of the included columns, you can use the scroll bar to scroll the column list.
You can use the following features to further explore the data diagram:
-
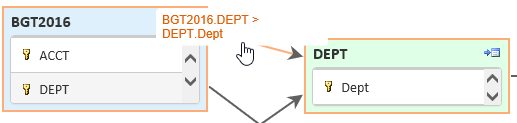
Hover your cursor over a relationship line to see the names of the two columns that make up the connection. The first column is the validated column and the second column is the lookup column. For example:
- While hovering your cursor over the diagram, use the scroll wheel on your mouse to zoom in or zoom out.
- To pan the diagram, hold the CTRL key and move your mouse in the direction that you want to pan.
