AX1712
About KPI tables
KPI tables store key performance indicators (KPIs) for your organization. These KPIs can be referenced in web reports and in Axiom forms using the KPI Panel component.
KPI tables have a predefined structure that maps to the properties used by the KPI Panel component. Once you assign the table to a KPI Panel component, the component automatically formats and positions the KPI data in the table into a series of KPI boxes. You can apply an optional filter to limit the KPIs shown in a particular component.
NOTE: This feature is only available to systems running Axiom Software version 2018.01.55 or higher.
Column structure for KPI Tables
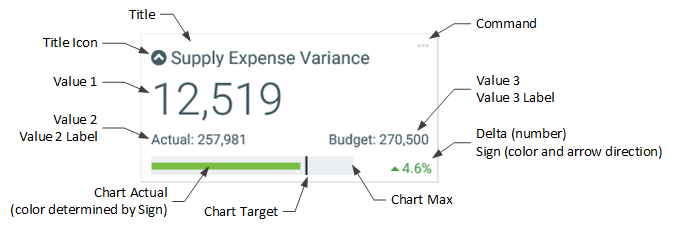
KPI tables have a predefined column structure that corresponds to the values used by the KPI Panel component. The following diagram shows how these values are displayed in each KPI box:
All of the following columns are created by default when the KPI table is created, and cannot be deleted. All string columns are non-Unicode.
| Name | Column Properties | Description |
|---|---|---|
| Name |
String (100) Key Column |
Defines a code that uniquely identifies each KPI in the table. The code can be anything you want, as long as it is unique. For example, you might use a meaningful code format like KPI_ExpenseVar or KPI_ExpenseVar_D42000 (where KPIs are stored by department). |
| Title |
String (250) |
The title of the KPI, displayed at the top of the KPI box. The title typically indicates the type of KPI, such as Supplies Expense Variance or Customer Retention. Note that if the title is too long to fit on one line, it will not wrap to a second line. Instead, the text displays with an ellipses, and the user can read the full title text in the tooltip. |
| TitleIcon | String (64) |
Optional. The name of an icon to display in the KPI title. Enter any valid icon name, such as To look up valid icon names, you can use the symbol chooser available for Formatted Grid components. In a form-enabled file, right-click a cell and then choose Insert Formatted Grid Tag > Symbol. Then use the [...] button to the right of the Symbol box to open the Choose Symbol dialog. You can hover your cursor over an icon to see its name. |
|
Value1 |
Numeric |
The primary value to highlight for the KPI. This value displays in large, bold font directly underneath the title. This is the value that you want to draw the most attention to. The number format of this value is determined by the value specified in the NumericType column. |
|
Value2 |
Numeric |
Optional. A secondary value to show for the KPI. Value 2 displays in smaller font to the left side of the KPI box, directly above the bullet chart. A label can be defined for this value, using the Value2Label column. The secondary values of Value 2 and Value 3 can be used to provide supporting information for the primary value or to provide additional information. For example, if the primary value is a variance, then Value 2 and Value 3 might display the actual and budget numbers used to calculate that variance. Or if the primary value is the actual number, then Value 2 and Value 3 might display the variance and the budget number to provide more context for the actual number. The values displayed are entirely user-definable. The number format of this value is determined by the value specified in the NumericType column. |
|
Value2Label |
String (100) |
Optional. The label for Value 2. The label precedes the value and displays with a colon, such as "Actuals: Value 2". The label should explain what Value 2 represents. |
|
Value3 |
Numeric |
Optional. A secondary value to show for the KPI. Value 3 displays in smaller font to the right side of the KPI box, directly above the Delta value. A label can be defined for this value, using the Value3Label column. The value displays using the number format defined for the cell. See the description of Value2 for more information. The number format of this value is determined by the value specified in the NumericType column. |
|
Value3Label |
String (100) |
Optional. The label for Value 3. The label precedes the value and displays with a colon, such as "Budget: Value 3". The label should explain what Value 3 represents. |
|
ChartTarget |
Numeric |
Optional. A value that defines the target line for the bullet chart. This value can be omitted if it is not needed on the chart, or if you are defining a KPI with no chart. |
|
ChartActual |
Numeric |
Optional. A value that defines the actual line for the bullet chart. This value is displayed using a red or green bar, where the color is determined by the Sign value. This value can be omitted if you are defining a KPI with no chart. |
|
ChartMax |
Numeric |
Optional. The maximum value of the bullet chart. The chart target and actual values are represented in relation to this maximum value. This value is required if you want to display a chart for the KPI. If you don't want to display a chart, omit this value. For example, if the actual value is 100 and the maximum value is 1000, then the actual bar will only take up 1/10th of the bullet chart. But if the maximum value is 150, then the actual bar will take up 2/3rds of the bullet chart. |
|
Delta |
Numeric |
Optional. A value that illustrates the positive or negative measure of the KPI. This value can be omitted if not needed. If it is omitted and the KPI has a bullet chart, then the chart extends to fill the bottom area of the KPI box. The value is displayed to the right of the bullet chart, in either red or green (as determined by the Sign value). The value displays using the number format defined for the cell. The Delta value can be used to show a variance percent or a raw difference value. It can also be used to show the change in value since the last time the primary KPI value was measured. |
|
Sign |
String (8) |
Optional. Specifies whether the primary KPI value is trending up (positive) or down (negative). Enter either
|
|
Style |
String (32) |
Optional. Specifies a color style to set the background color of the KPI box. The following Axiom color styles are supported (specify one per KPI): S1, S6, A11, A51, P5, P6, P7, P9, P10. When using darker background colors, the text in the KPI automatically adjusts to white. |
|
Tooltip |
String (250) |
Optional. Defines a tooltip to display when a user hovers over the command button in the KPI box. The tooltip should tell the user what action will occur when the user clicks the button. If no command is defined, the button does not display and the tooltip is ignored. |
|
Command |
String (1023) |
Optional. Specifies an action to execute when the user clicks the ... button in the top right corner of the KPI box. If a KPI does not have a defined command, no button displays on the box. The action can be any of the following:
Commands from the Command Library are only supported when the KPI table is used by a KPI Panel in an Axiom form. Web reports do not support use of commands, but will honor URLs and document shortcuts. To create a command string, you can use Axiom Wizards > Command Wizard on the right-click menu in any Axiom file. |
|
NumericType |
String (16) |
Specifies the numeric type of the values in Value1, Value2, and Value3 columns:
This determines the format of these values within the KPI box. If blank, Number is assumed. The Numeric Type defined on the individual value columns is not used. |
|
DeltaNumericType |
String(16) |
Specifies the numeric type of the value in the Delta column:
This determines the format of the Delta value within the KPI box. If blank, Number is assumed. The Numeric Type defined on the Delta column is not used. |
|
Hidden |
Boolean |
Specifies whether the KPI row is omitted from KPI Panel components (True/False). The default value is False. You can set this to True in order to temporarily hide a KPI, or to archive a KPI without deleting it. |
|
CalculatedDateTime |
DateTime |
Optional. Specifies the date/time of the KPI calculation. If defined, this value displays on the tooltip for the KPI title. This is not an automatically calculated value, because the applicable date/time of the KPI may be different than the date/time the value was saved to the table. If you want to use this value, it must be explicitly defined and saved to the KPI table along with the other values. |
The main column properties of KPI columns cannot be modified, such as column name, data type, key column status, etc. Only minor column properties such as read-only status can be modified.
Creating KPI tables
KPI tables have a special editor in the Web Client, designed to make it easy for table administrators to create new KPI tables.
Currently, KPI tables can only be created in the Web Client. Once a table has been created, additional columns can be added as needed using the standard Edit Table feature in the Desktop Client.
To populate a KPI table with KPI values, you can use any of the standard features for populating tables, such as Save Type 1 and Open Table in Spreadsheet.
Using KPI tables
KPI tables have a set structure that provides the necessary KPI properties for a KPI Panel component. You can configure the component to use a KPI table, and then that component is automatically populated with the KPIs in the table.
KPI tables can be used KPI Panel components in Axiom forms and in web reports.
- In web reports, KPI Panel components are required to use a KPI table in order to provide KPI data to the component.
- In Axiom forms, KPI Panel components can use either a KPI table or a data source defined within the spreadsheet.
When configuring a KPI Panel component, you can optionally specify a filter to determine the KPIs that display in the component. For example, if you have added a Dept or Entity column to the KPI table, you can filter the component to only show KPIs relating to a particular department or entity. Any KPI with Hidden set to True is automatically hidden from all KPI Panel components.
KPI table restrictions and limitations
KPI tables follow the same general rules of reference tables, with some additional restrictions. In addition to the pre-set column structure, the following limitations and restrictions apply to KPI tables:
- KPI tables cannot be plan code tables.
- KPI tables cannot have column hierarchies, column sequences, or calculated fields.
When filtering a list of tables by table classification, KPI tables will display along with the other reference tables, unless they are being omitted from the list as invalid selections.
Generally speaking, whenever a feature says a reference table is valid for use, a KPI table can be used as well. Any exceptions are noted in the specific feature documentation.
KPI table security
By default, non-admin users do not have access to the data in KPI tables. When a new KPI table is created, you must configure read-only or read / write access to the table as needed (unless the KPI table is assigned to a table type to inherit permissions).
Note the following considerations for KPI table security:
-
KPI tables can belong to table types, for purposes of easily granting full read or write access to a set of related tables. You can then grant access at the table type level, to be inherited by all tables in the table type. KPI tables can belong to any table type that uses the reference table classification; there is no special table type classification for KPI tables.
-
KPI tables can be created by administrators or by users with the Administer Tables permission. There is no special permission specifically for administering KPI tables. Once a KPI table is created, standard table and table type permissions apply.
AX1348